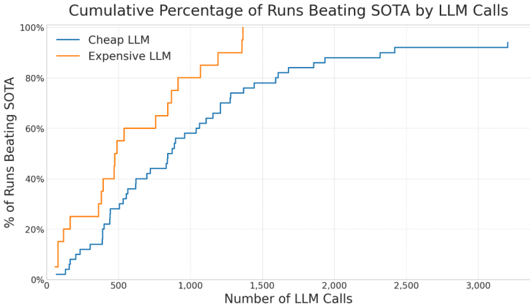
## Chart: Cumulative Percentage of Runs Beating SOTA by LLM Calls
### Overview
The image is a cumulative percentage graph comparing the performance of "Cheap LLM" and "Expensive LLM" in terms of the percentage of runs beating the State-of-the-Art (SOTA) as a function of the number of LLM calls. The graph shows two step-like lines, one for each LLM, plotting the cumulative percentage of runs that outperform SOTA as the number of LLM calls increases.
### Components/Axes
* **Title:** Cumulative Percentage of Runs Beating SOTA by LLM Calls
* **X-axis:** Number of LLM Calls, ranging from 0 to 3,000 in increments of 500.
* **Y-axis:** % of Runs Beating SOTA, ranging from 0% to 100% in increments of 20%.
* **Legend:** Located in the top-left corner.
* **Blue:** Cheap LLM
* **Orange:** Expensive LLM
### Detailed Analysis
* **Cheap LLM (Blue):** The blue line represents the cumulative percentage of runs beating SOTA for the Cheap LLM. The line generally slopes upward, indicating that as the number of LLM calls increases, the percentage of runs beating SOTA also increases.
* At 0 LLM calls, the percentage is approximately 0%.
* At 500 LLM calls, the percentage is approximately 20%.
* At 1000 LLM calls, the percentage is approximately 45%.
* At 1500 LLM calls, the percentage is approximately 70%.
* At 2000 LLM calls, the percentage is approximately 75%.
* At 2500 LLM calls, the percentage is approximately 75%.
* At 3000 LLM calls, the percentage is approximately 75%.
* **Expensive LLM (Orange):** The orange line represents the cumulative percentage of runs beating SOTA for the Expensive LLM. The line generally slopes upward, indicating that as the number of LLM calls increases, the percentage of runs beating SOTA also increases.
* At 0 LLM calls, the percentage is approximately 0%.
* At 500 LLM calls, the percentage is approximately 25%.
* At 1000 LLM calls, the percentage is approximately 65%.
* At 1500 LLM calls, the percentage is approximately 95%.
### Key Observations
* The Expensive LLM generally outperforms the Cheap LLM at lower numbers of LLM calls.
* Both LLMs show an increase in the percentage of runs beating SOTA as the number of LLM calls increases.
* The Expensive LLM reaches a higher percentage of runs beating SOTA compared to the Cheap LLM.
* The Cheap LLM appears to plateau around 75% after 2000 LLM calls.
### Interpretation
The data suggests that using a more expensive LLM leads to a higher percentage of runs beating the State-of-the-Art, especially with fewer LLM calls. The Expensive LLM achieves a higher performance level overall. The Cheap LLM's performance plateaus, indicating that increasing the number of calls beyond a certain point does not significantly improve its ability to beat SOTA. This could be due to limitations in the model's architecture or training data. The Expensive LLM continues to improve with more calls, suggesting it can leverage additional calls more effectively.