## Chart: Cumulative Percentage of Runs Beating SOTA by LLM Calls
### Overview
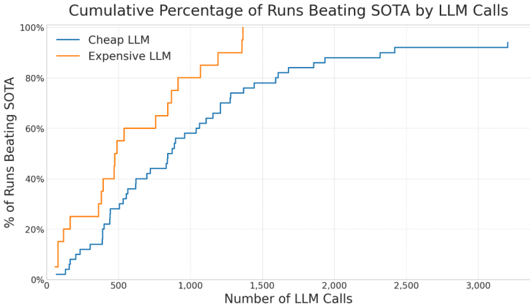
The image presents a chart illustrating the cumulative percentage of runs where Large Language Models (LLMs) outperform the State-of-the-Art (SOTA) based on the number of LLM calls made. Two LLM types are compared: a "Cheap LLM" and an "Expensive LLM". The chart is a cumulative distribution plot, showing how the percentage of successful runs increases with the number of LLM calls.
### Components/Axes
* **Title:** "Cumulative Percentage of Runs Beating SOTA by LLM Calls" (Top-center)
* **X-axis:** "Number of LLM Calls" (Bottom-center), ranging from 0 to 3000, with markers at 0, 500, 1000, 1500, 2000, 2500, and 3000.
* **Y-axis:** "% of Runs Beating SOTA" (Left-center), ranging from 0% to 100%, with markers at 0%, 20%, 40%, 60%, 80%, and 100%.
* **Legend:** Located in the top-left corner.
* "Cheap LLM" - represented by a blue line.
* "Expensive LLM" - represented by an orange line.
### Detailed Analysis
The chart displays two cumulative distribution curves.
**Cheap LLM (Blue Line):**
The blue line starts at approximately 0% at 0 LLM calls. It rises relatively slowly until around 500 LLM calls, reaching approximately 20%. The curve then increases more rapidly between 500 and 1500 LLM calls, reaching approximately 80% at 1500 calls. The curve plateaus between 1500 and 3000 LLM calls, reaching approximately 92% at 3000 calls.
* 0 LLM Calls: ~0%
* 500 LLM Calls: ~20%
* 1000 LLM Calls: ~50%
* 1500 LLM Calls: ~80%
* 2000 LLM Calls: ~86%
* 2500 LLM Calls: ~90%
* 3000 LLM Calls: ~92%
**Expensive LLM (Orange Line):**
The orange line also starts at approximately 0% at 0 LLM calls. It rises quickly between 0 and 500 LLM calls, reaching approximately 20% at 500 calls. The curve continues to increase rapidly between 500 and 1000 LLM calls, reaching approximately 60% at 1000 calls. The curve then slows down, reaching approximately 90% at 1500 LLM calls, and plateaus around 95% between 1500 and 3000 LLM calls.
* 0 LLM Calls: ~0%
* 500 LLM Calls: ~20%
* 1000 LLM Calls: ~60%
* 1500 LLM Calls: ~90%
* 2000 LLM Calls: ~93%
* 2500 LLM Calls: ~95%
* 3000 LLM Calls: ~95%
### Key Observations
* The "Expensive LLM" generally outperforms the "Cheap LLM" in terms of the cumulative percentage of runs beating SOTA, especially at lower numbers of LLM calls.
* Both LLMs exhibit diminishing returns as the number of LLM calls increases. The rate of improvement slows down significantly after a certain point.
* The "Expensive LLM" reaches a higher plateau than the "Cheap LLM", indicating that it is more likely to achieve high performance even with a large number of calls.
### Interpretation
The data suggests that while both LLM types can outperform the SOTA, the "Expensive LLM" is more efficient in doing so, requiring fewer LLM calls to achieve a given level of performance. The diminishing returns observed for both LLMs indicate that there is a limit to the benefit of increasing the number of LLM calls. This could be due to factors such as the inherent limitations of the LLM architecture, the quality of the training data, or the complexity of the task. The chart highlights the trade-off between cost (LLM calls) and performance (percentage of runs beating SOTA). The "Expensive LLM" represents a higher upfront cost but potentially lower overall cost due to its efficiency. The plateauing of both curves suggests that further investment in LLM calls beyond a certain point may not yield significant improvements in performance.