## Scatter Plot: Performance vs. Average Token Usage
### Overview
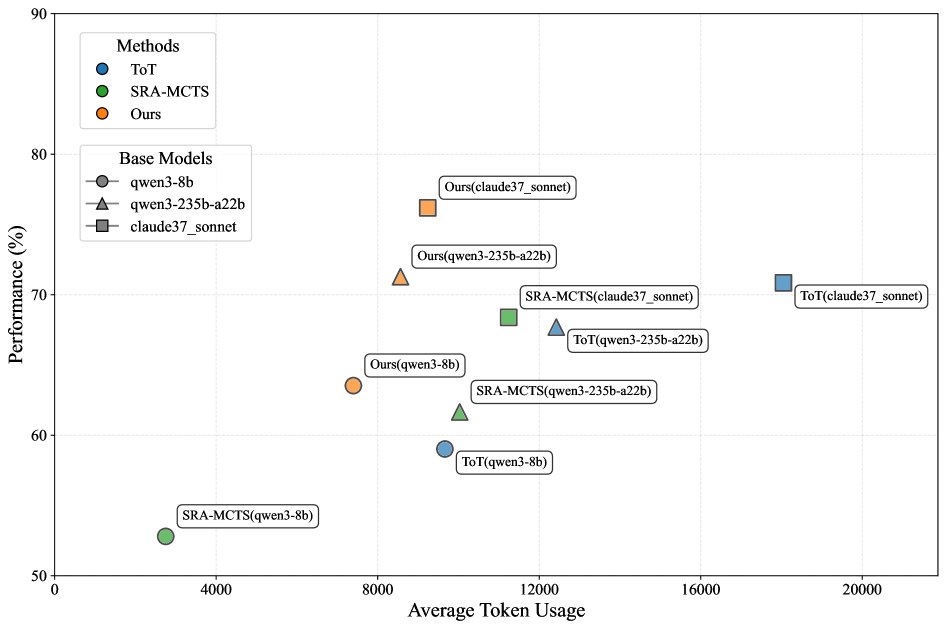
The image is a scatter plot comparing the performance (y-axis, %) of different methods against their average token usage (x-axis, tokens). Three methods are compared: ToT (blue), SRA-MCTS (green), and "Ours" (orange). Three base models are represented: qwen3-8b (circle), qwen3-235b-a22b (triangle), and claude37_sonnet (square). Data points are labeled with their method-base model combinations.
### Components/Axes
- **X-axis**: "Average Token Usage" (0 to 20,000 tokens, increments of 4,000)
- **Y-axis**: "Performance (%)" (50% to 90%, increments of 10%)
- **Legend**:
- Top-left corner, labeled "Methods":
- Blue circle: ToT
- Green square: SRA-MCTS
- Orange triangle: Ours
- **Base Models**:
- qwen3-8b: Gray circle
- qwen3-235b-a22b: Gray triangle
- claude37_sonnet: Gray square
### Detailed Analysis
1. **SRA-MCTS(qwen3-8b)**:
- Position: (3,000 tokens, 53%)
- Color: Green square
- Label: "SRA-MCTS(qwen3-8b)"
2. **ToT(qwen3-8b)**:
- Position: (9,000 tokens, 58%)
- Color: Blue circle
- Label: "ToT(qwen3-8b)"
3. **Ours(qwen3-8b)**:
- Position: (7,500 tokens, 64%)
- Color: Orange triangle
- Label: "Ours(qwen3-8b)"
4. **SRA-MCTS(qwen3-235b-a22b)**:
- Position: (11,000 tokens, 62%)
- Color: Green square
- Label: "SRA-MCTS(qwen3-235b-a22b)"
5. **ToT(qwen3-235b-a22b)**:
- Position: (13,000 tokens, 67%)
- Color: Blue circle
- Label: "ToT(qwen3-235b-a22b)"
6. **Ours(qwen3-235b-a22b)**:
- Position: (8,500 tokens, 72%)
- Color: Orange triangle
- Label: "Ours(qwen3-235b-a22b)"
7. **SRA-MCTS(claude37_sonnet)**:
- Position: (12,000 tokens, 68%)
- Color: Green square
- Label: "SRA-MCTS(claude37_sonnet)"
8. **ToT(claude37_sonnet)**:
- Position: (19,000 tokens, 71%)
- Color: Blue circle
- Label: "ToT(claude37_sonnet)"
9. **Ours(claude37_sonnet)**:
- Position: (8,000 tokens, 76%)
- Color: Orange triangle
- Label: "Ours(claude37_sonnet)"
### Key Observations
- **Performance Trends**:
- "Ours" method consistently achieves higher performance (64–76%) across all base models.
- SRA-MCTS shows moderate performance (53–68%) but requires higher token usage (3,000–12,000 tokens).
- ToT exhibits variable performance (58–71%) with the highest token usage (9,000–19,000 tokens).
- **Token Efficiency**:
- "Ours" achieves the best performance-to-token ratio, especially with claude37_sonnet (76% at 8,000 tokens).
- ToT requires the most tokens for comparable performance (e.g., 19,000 tokens for 71% vs. 8,000 tokens for 76% with "Ours").
- **Outliers**:
- SRA-MCTS(qwen3-8b) is the lowest-performing point (53% at 3,000 tokens).
- ToT(claude37_sonnet) uses the most tokens (19,000) for only 71% performance.
### Interpretation
The data suggests that the "Ours" method outperforms both ToT and SRA-MCTS in terms of performance while maintaining lower token usage. This indicates superior efficiency, particularly when paired with the claude37_sonnet base model. SRA-MCTS appears less efficient, requiring more tokens for similar or lower performance gains. ToT's performance scales with token usage but remains less efficient than "Ours." The results highlight a trade-off between computational resource consumption and output quality, with "Ours" offering the most favorable balance.