\n
## Scatter Plot: Performance vs. Token Usage for Different Methods and Base Models
### Overview
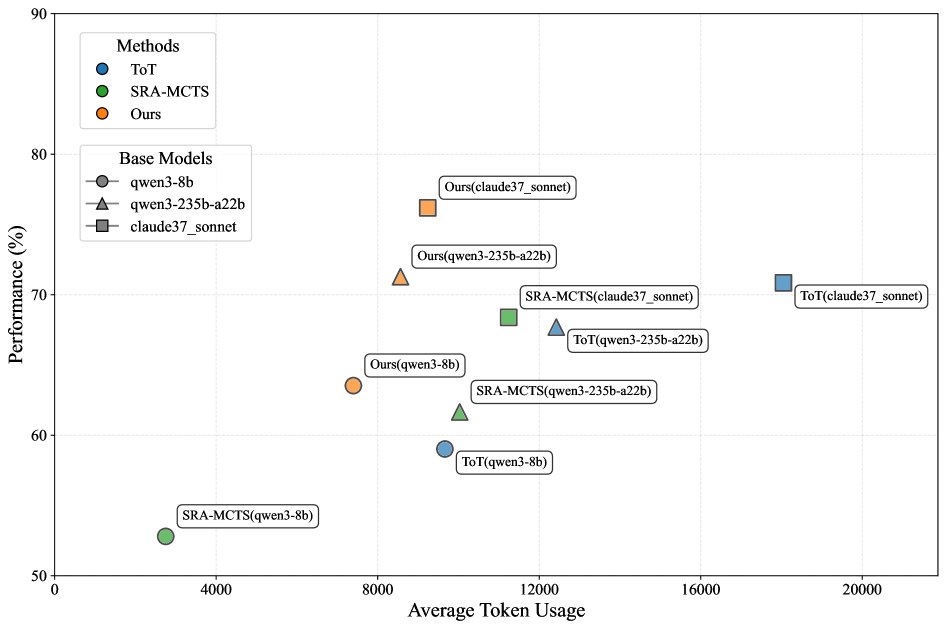
This scatter plot visualizes the relationship between Performance (in percentage) and Average Token Usage for three different methods (ToT, SRA-MCTS, and Ours) applied to three different base models (qwen3-8b, qwen3-235b-a22b, and claude37_sonnet). Each data point represents a specific combination of method and base model. The plot aims to compare the efficiency and effectiveness of these methods.
### Components/Axes
* **X-axis:** Average Token Usage (ranging from 0 to 20000, with increments of 4000).
* **Y-axis:** Performance (%) (ranging from 50 to 90, with increments of 10).
* **Legend (Top-Left):**
* Methods:
* ToT (Blue circles)
* SRA-MCTS (Green squares)
* Ours (Orange triangles)
* Base Models:
* qwen3-8b (Grey circles)
* qwen3-235b-a22b (Grey triangles)
* claude37_sonnet (Grey squares)
* **Data Points:** Each point is labeled with the method and base model it represents (e.g., "ToT(claude37_sonnet)").
### Detailed Analysis
Here's a breakdown of the data points, categorized by method and base model, with approximate values read from the plot:
**ToT (Blue Circles):**
* ToT(qwen3-8b): Approximately (4000, 58%). Line slopes upward.
* ToT(qwen3-235b-a22b): Approximately (12000, 68%). Line slopes upward.
* ToT(claude37_sonnet): Approximately (20000, 72%). Line slopes upward.
**SRA-MCTS (Green Squares):**
* SRA-MCTS(qwen3-8b): Approximately (4000, 52%). Line slopes upward.
* SRA-MCTS(qwen3-235b-a22b): Approximately (12000, 64%). Line slopes upward.
* SRA-MCTS(claude37_sonnet): Approximately (12000, 68%). Line slopes upward.
**Ours (Orange Triangles):**
* Ours(qwen3-8b): Approximately (8000, 65%). Line slopes upward.
* Ours(qwen3-235b-a22b): Approximately (8000, 72%). Line slopes upward.
* Ours(claude37_sonnet): Approximately (8000, 81%). Line slopes upward.
### Key Observations
* **Performance Trend:** Generally, performance increases with increasing Average Token Usage for all methods and base models.
* **Method Comparison:** "Ours" consistently achieves the highest performance across all base models, especially with claude37_sonnet.
* **Base Model Impact:** claude37_sonnet consistently yields the highest performance when combined with any of the methods.
* **Efficiency:** SRA-MCTS and ToT achieve lower performance with lower token usage, while "Ours" requires more tokens but delivers significantly better performance.
* **Outlier:** The point "Ours(claude37_sonnet)" stands out as having the highest performance (approximately 81%).
### Interpretation
The data suggests that the "Ours" method is the most effective in terms of performance, but it comes at the cost of higher Average Token Usage. The choice of base model significantly impacts performance, with claude37_sonnet being the superior choice. The trade-off between performance and token usage is a key consideration.
The upward slopes of the lines for each method indicate a positive correlation between token usage and performance. This suggests that increasing the computational resources (token usage) can lead to improved results. The clustering of points for each base model suggests that the base model itself is a significant factor in determining the overall performance.
The fact that "Ours" consistently outperforms the other methods, particularly with the claude37_sonnet model, suggests that this combination is the most promising for achieving high performance in this task. The data also highlights the importance of considering the computational cost (token usage) when selecting a method and base model.