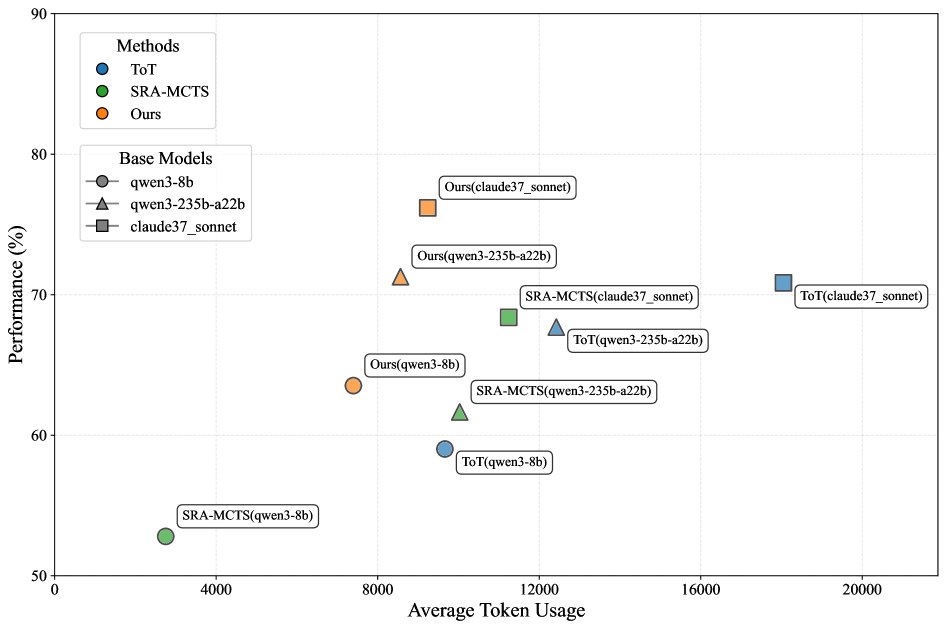
## Scatter Plot: Method Performance vs. Average Token Usage
### Overview
This image is a scatter plot comparing the performance (in percentage) of three different methods (ToT, SRA-MCTS, and "Ours") across three different base models (qwen3-8b, qwen3-235b-a22b, claude37_sonnet). The plot visualizes the trade-off between performance and computational cost, measured by average token usage.
### Components/Axes
* **Y-Axis:** Labeled "Performance (%)". Scale ranges from 50 to 90, with major tick marks every 10 units (50, 60, 70, 80, 90).
* **X-Axis:** Labeled "Average Token Usage". Scale ranges from 0 to 20,000, with major tick marks every 4,000 units (0, 4000, 8000, 12000, 16000, 20000).
* **Legend 1 (Top-Left):** Titled "Methods". Defines the color coding for the three methods:
* Blue circle: ToT
* Green circle: SRA-MCTS
* Orange circle: Ours
* **Legend 2 (Below Legend 1):** Titled "Base Models". Defines the shape coding for the three base models:
* Circle: qwen3-8b
* Triangle: qwen3-235b-a22b
* Square: claude37_sonnet
* **Data Points:** Each point is labeled with the format "Method(Base Model)". The color indicates the method, and the shape indicates the base model.
### Detailed Analysis
The plot contains 9 distinct data points. Below is a reconstruction of each point's approximate coordinates and label, grouped by method.
**Method: Ours (Orange)**
1. **Label:** Ours(qwen3-8b)
* **Shape:** Circle
* **Approx. Coordinates:** (7500, 63.5)
* **Trend:** This is the lowest token usage point for the "Ours" method.
2. **Label:** Ours(qwen3-235b-a22b)
* **Shape:** Triangle
* **Approx. Coordinates:** (8500, 71)
* **Trend:** Shows a significant performance increase over the 8b model with a modest increase in token usage.
3. **Label:** Ours(claude37_sonnet)
* **Shape:** Square
* **Approx. Coordinates:** (9500, 76)
* **Trend:** The highest-performing point on the entire chart, using fewer tokens than many competing methods.
**Method: SRA-MCTS (Green)**
1. **Label:** SRA-MCTS(qwen3-8b)
* **Shape:** Circle
* **Approx. Coordinates:** (2500, 52.5)
* **Trend:** The lowest performance and lowest token usage point on the chart.
2. **Label:** SRA-MCTS(qwen3-235b-a22b)
* **Shape:** Triangle
* **Approx. Coordinates:** (10000, 61.5)
* **Trend:** Higher performance and token usage than its 8b counterpart.
3. **Label:** SRA-MCTS(claude37_sonnet)
* **Shape:** Square
* **Approx. Coordinates:** (11500, 68.5)
* **Trend:** The highest-performing configuration for SRA-MCTS.
**Method: ToT (Blue)**
1. **Label:** ToT(qwen3-8b)
* **Shape:** Circle
* **Approx. Coordinates:** (9500, 59)
* **Trend:** Uses significantly more tokens than SRA-MCTS for a similar performance level on the same base model.
2. **Label:** ToT(qwen3-235b-a22b)
* **Shape:** Triangle
* **Approx. Coordinates:** (12500, 67.5)
* **Trend:** Higher performance and token usage than its 8b counterpart.
3. **Label:** ToT(claude37_sonnet)
* **Shape:** Square
* **Approx. Coordinates:** (18000, 70.5)
* **Trend:** The highest token usage point on the chart by a large margin.
### Key Observations
1. **Performance Hierarchy:** For every base model, the "Ours" method achieves the highest performance, followed generally by ToT, then SRA-MCTS.
2. **Token Efficiency:** The "Ours" method demonstrates superior token efficiency. For example, "Ours(claude37_sonnet)" achieves ~76% performance with ~9500 tokens, while "ToT(claude37_sonnet)" achieves only ~70.5% performance with ~18000 tokens.
3. **Base Model Scaling:** All three methods show a consistent trend: performance increases when moving from the qwen3-8b (circle) to qwen3-235b-a22b (triangle) to claude37_sonnet (square) base model. Token usage also generally increases with model scale.
4. **Outlier:** The "ToT(claude37_sonnet)" point is a clear outlier in terms of token usage, positioned far to the right of all other data points.
### Interpretation
This chart presents a compelling case for the efficacy of the "Ours" method. It suggests that this new approach achieves a better performance-to-cost ratio than the compared baselines (ToT and SRA-MCTS). The data demonstrates that "Ours" not only reaches higher peak performance but does so with greater computational efficiency (lower token usage).
The relationship between the points indicates that while all methods benefit from more powerful base models, the "Ours" method leverages this increased model capacity more effectively, yielding greater performance gains per additional token spent. The significant rightward position of the ToT method, especially with the strongest base model, implies it may have a higher inherent computational overhead or a less efficient search strategy compared to the other methods evaluated. The chart effectively argues that the proposed method ("Ours") advances the state-of-the-art by optimizing both the quality of the solution and the resources required to find it.