\n
## Stacked Bar Chart: Success Rates
### Overview
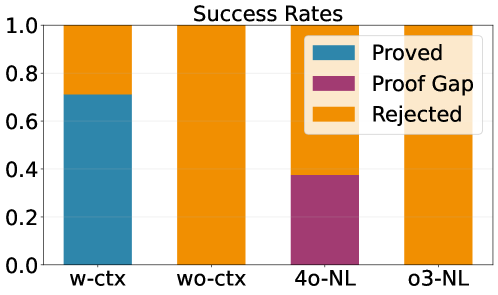
The image presents a stacked bar chart illustrating success rates across four different conditions: "w-ctx", "wo-ctx", "4o-NL", and "o3-NL". The chart displays the proportion of outcomes categorized as "Proved", "Proof Gap", and "Rejected" for each condition. The y-axis represents the success rate, ranging from 0.0 to 1.0.
### Components/Axes
* **Title:** "Success Rates" (centered at the top)
* **X-axis:** Represents the conditions: "w-ctx", "wo-ctx", "4o-NL", "o3-NL".
* **Y-axis:** Represents the success rate, ranging from 0.0 to 1.0, with increments of 0.2.
* **Legend:** Located in the top-right corner, defining the colors for each category:
* "Proved" - Light Blue (#87CEEB)
* "Proof Gap" - Purple (#9370DB)
* "Rejected" - Orange (#FFA07A)
### Detailed Analysis
The chart consists of four stacked bars, one for each condition.
* **w-ctx:** The "Proved" portion is approximately 0.7, and the "Rejected" portion fills the remaining space to reach 1.0.
* **wo-ctx:** The "Rejected" portion dominates, reaching approximately 0.9. The "Proved" portion is minimal, around 0.1.
* **4o-NL:** The "Proof Gap" portion is approximately 0.35, the "Rejected" portion is approximately 0.65. There is no "Proved" portion.
* **o3-NL:** The "Rejected" portion is approximately 0.75, and the "Proof Gap" portion is approximately 0.25. There is no "Proved" portion.
### Key Observations
* The "w-ctx" condition has the highest proportion of "Proved" outcomes.
* The "wo-ctx" condition has the highest proportion of "Rejected" outcomes.
* The "4o-NL" and "o3-NL" conditions do not have any "Proved" outcomes.
* The "Proof Gap" category is only present in the "4o-NL" and "o3-NL" conditions.
### Interpretation
The data suggests that the presence of context ("w-ctx") significantly improves the success rate, specifically increasing the proportion of "Proved" outcomes. Conversely, the absence of context ("wo-ctx") leads to a high rate of rejection. The "4o-NL" and "o3-NL" conditions, which do not include "Proved" outcomes, indicate that these conditions are more likely to result in either a "Proof Gap" or a "Rejected" outcome. The difference between "4o-NL" and "o3-NL" suggests that the specific configuration of these conditions influences the balance between "Proof Gap" and "Rejected" outcomes.
The chart likely represents the performance of a system or process under different settings. The "Proved", "Proof Gap", and "Rejected" categories could refer to the stages of a verification or validation process. The context ("ctx") might represent additional information or resources available to the system. The "NL" conditions may represent different Natural Language processing configurations.