## Bar Chart: Success Rates
### Overview
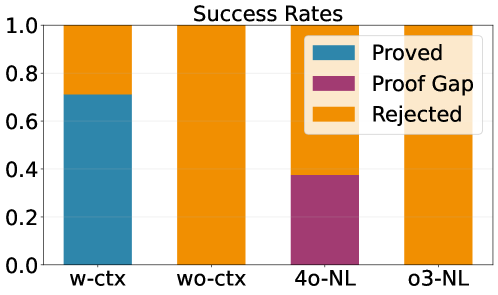
The chart displays success rates across four categories: "w-ctx," "wo-ctx," "4o-NL," and "o3-NL." Each category is represented by a stacked bar divided into three segments: "Proved" (blue), "Proof Gap" (purple), and "Rejected" (orange). The y-axis ranges from 0.0 to 1.0, indicating normalized success rates.
### Components/Axes
- **X-axis**: Categories labeled "w-ctx," "wo-ctx," "4o-NL," and "o3-NL."
- **Y-axis**: Labeled "Success Rates," scaled from 0.0 to 1.0 in increments of 0.2.
- **Legend**: Located in the top-right corner, mapping colors to categories:
- Blue: Proved
- Purple: Proof Gap
- Orange: Rejected
### Detailed Analysis
1. **w-ctx**:
- Proved (blue): ~0.7
- Rejected (orange): ~0.3
- Proof Gap (purple): 0.0 (no visible segment).
2. **wo-ctx**:
- Rejected (orange): ~1.0
- Proved (blue) and Proof Gap (purple): 0.0 (no visible segments).
3. **4o-NL**:
- Proof Gap (purple): ~0.4
- Rejected (orange): ~0.6
- Proved (blue): 0.0 (no visible segment).
4. **o3-NL**:
- Rejected (orange): ~1.0
- Proved (blue) and Proof Gap (purple): 0.0 (no visible segments).
### Key Observations
- **wo-ctx** and **o3-NL** have 100% rejection rates, with no success or proof gaps.
- **4o-NL** shows a significant "Proof Gap" (~40%) and rejection (~60%), with no proven successes.
- **w-ctx** has the highest success rate (~70% proven), with minimal rejection (~30%).
### Interpretation
The data suggests that "w-ctx" performs best in terms of proven success, while "wo-ctx" and "o3-NL" are entirely rejected. The "Proof Gap" in "4o-NL" indicates unresolved issues in validating success, potentially highlighting methodological or evidentiary challenges. The absence of "Proved" segments in "wo-ctx" and "o3-NL" implies these categories fail to meet baseline criteria for success or proof. The chart emphasizes the importance of contextual factors (e.g., "ctx" vs. "NL") in determining outcomes.