## Line Graph: Performance Metrics Over Iterations
### Overview
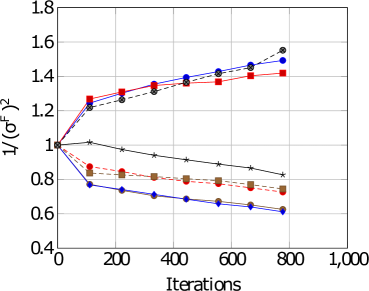
The image depicts a line graph comparing four distinct data series (Model A, Model B, Model C, Model D) across 1,000 iterations. The y-axis represents the inverse of the squared standard deviation of a fitness function (1/(σ_F²)), while the x-axis tracks iterations in increments of 200. All series originate at (0,1) and diverge over time, with Model A achieving the highest final value and Model D the lowest.
### Components/Axes
- **X-axis**: "Iterations" (0 to 1,000, increments of 200)
- **Y-axis**: "1/(σ_F²)" (0.4 to 1.8, increments of 0.2)
- **Legend**: Located in the top-right corner, associating:
- Black dashed line with star markers → Model A
- Red solid line with square markers → Model B
- Blue solid line with circle markers → Model C
- Brown dashed line with diamond markers → Model D
### Detailed Analysis
1. **Model A (Black Dashed/Star)**:
- Starts at (0,1.0)
- Gradual upward trend, reaching **1.55** at 1,000 iterations
- Steady increase with no plateaus
2. **Model B (Red Solid/Square)**:
- Starts at (0,1.0)
- Slight dip to **0.95** at 200 iterations
- Rises to **1.4** by 1,000 iterations
- Moderate growth after initial fluctuation
3. **Model C (Blue Solid/Circle)**:
- Starts at (0,1.0)
- Consistent upward trajectory
- Reaches **1.45** at 1,000 iterations
- Slightly outperforms Model B in final value
4. **Model D (Brown Dashed/Diamond)**:
- Starts at (0,1.0)
- Sharp decline to **0.65** by 400 iterations
- Stabilizes near **0.7** by 1,000 iterations
- Lowest final value among all models
### Key Observations
- All models begin at identical y-value (1.0) at iteration 0.
- Model A demonstrates the most significant improvement (+55% from start to end).
- Model D exhibits the steepest decline (-35% drop by 400 iterations).
- Models B and C show divergent paths despite similar final values.
- No overlapping data points after iteration 200.
### Interpretation
The graph suggests a comparative analysis of optimization algorithms or model training processes. Model A's consistent growth implies superior convergence properties, while Model D's decline may indicate instability or suboptimal parameter tuning. The divergence between Models B and C highlights sensitivity to initialization or hyperparameters. The inverse relationship between σ_F² and the y-axis metric suggests that higher values correspond to greater stability or precision in the modeled system. The absence of error bars implies deterministic results, though real-world applications would require uncertainty quantification.