\n
## Diagram: Network/Path Visualization
### Overview
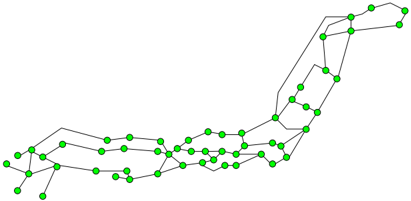
The image depicts a network or path visualization consisting of interconnected green nodes connected by gray lines. The arrangement of nodes and lines suggests a somewhat meandering or branching path. There are no axis labels, legends, or numerical data associated with the diagram. It appears to be a purely structural representation of connections.
### Components/Axes
There are no explicit axes or legends. The diagram consists solely of:
* **Nodes:** Approximately 40 green circular nodes.
* **Edges:** Approximately 45 gray lines connecting the nodes.
### Detailed Analysis / Content Details
The diagram can be described as a series of connected nodes forming a path. The path begins on the left side of the image and extends towards the right, with several branches and deviations.
Here's a breakdown of the path's structure, noting approximate node counts within sections:
1. **Initial Segment (Left):** Approximately 8 nodes, forming a relatively straight line.
2. **Branching Section:** The path splits into two branches, each with approximately 6-7 nodes.
3. **Convergence & Ascent:** The branches rejoin, and the path begins to ascend diagonally towards the top-right. This section contains approximately 10 nodes.
4. **Upper Segment (Right):** The path continues horizontally towards the right, with approximately 8-10 nodes.
5. **Final Node:** The path terminates with a single node at the top-right corner.
The connections between nodes appear to be one-to-one, meaning each line connects exactly two nodes. There are no loops or cycles visible in the diagram.
### Key Observations
* The diagram lacks any quantitative information. It's a purely topological representation.
* The branching structure suggests a decision-making process or multiple possible routes.
* The ascending segment could represent an increase in some value or level.
* The overall shape of the path is irregular and non-linear.
### Interpretation
The diagram likely represents a network, a process flow, or a path through a system. Without additional context, it's difficult to determine the specific meaning. The branching suggests choices or alternatives, while the overall path could represent a sequence of steps or a journey. The absence of labels or numerical data makes it impossible to draw definitive conclusions.
The diagram could be a simplified representation of:
* **A decision tree:** Each node represents a decision point, and the branches represent different choices.
* **A network topology:** Each node represents a device or component, and the lines represent connections between them.
* **A process flow:** Each node represents a step in a process, and the lines represent the flow of work.
* **A route or path:** Each node represents a location, and the lines represent the connections between them.
Further information about the context of the diagram is needed to provide a more accurate interpretation. It is a visual representation of relationships, but lacks the data to quantify those relationships.