## Network Diagram: Unlabeled Graph Structure
### Overview
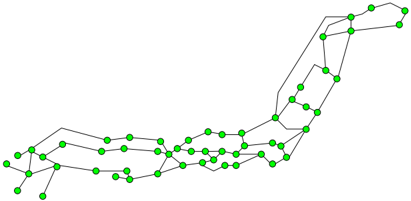
The image displays a complex, unlabeled network diagram or graph structure. It consists of numerous nodes (vertices) connected by edges (links) against a plain white background. There is no textual information, labels, titles, legends, or numerical data present in the image. The diagram appears to represent a topological map, a network topology, or a graph theory visualization.
### Components/Axes
* **Nodes:** Represented as small, solid green circles. There are approximately 60-70 nodes in total.
* **Edges:** Represented as thin, gray lines connecting the nodes. The connections form a non-planar graph with multiple intersecting paths.
* **Layout:** The graph is arranged in a roughly horizontal orientation, stretching from the left to the right side of the image. It is not organized into a standard grid or hierarchical tree.
* **Text/Labels:** **None.** The diagram contains no axis titles, node labels, legend, or any form of textual annotation.
### Detailed Analysis
* **Spatial Distribution:** The network is not uniformly dense.
* **Left Region:** Features a relatively dense, interconnected cluster of nodes with many short connections, forming a mesh-like substructure.
* **Central Region:** The density decreases slightly, with nodes forming longer, more linear chains that bridge the left and right sections.
* **Right Region:** The structure becomes more elongated and sparse. A prominent feature is a long, winding chain of nodes that extends upward and to the right, resembling a "tail" or a primary backbone. This chain has several small offshoots.
* **Connectivity Patterns:**
* Most nodes have a degree (number of connections) between 2 and 4.
* There are no obvious isolated nodes; the entire structure appears to be a single connected component.
* The graph contains multiple cycles (closed loops) of varying sizes, particularly in the denser left region.
* The long chain on the right has a more linear, path-like structure with fewer cycles.
### Key Observations
1. **Absence of Metadata:** The most significant observation is the complete lack of identifying information. The purpose, subject, and scale of the network are entirely undefined.
2. **Structural Heterogeneity:** The graph exhibits clear regional variation in density and connectivity, suggesting it may model a real-world system with different functional zones (e.g., a core cluster and peripheral branches).
3. **Visual Style:** The use of uniform green nodes and gray edges is simple and functional, prioritizing the display of connections over node differentiation.
### Interpretation
* **What the Data Suggests:** Without labels, the diagram is an abstract representation of relationships. It demonstrates a system where entities (nodes) are interconnected in a complex, non-hierarchical web. The structure implies information flow, dependency, or connection paths that are not centralized.
* **How Elements Relate:** The relationships are defined solely by the edges. The proximity of nodes in the layout may imply stronger connectivity or a shared function, but this is a visual artifact of the graph-drawing algorithm, not an explicit data point. The dense left cluster could represent a core network, while the extended right chain could represent a peripheral or access network.
* **Notable Anomalies:** The primary anomaly is the lack of context. For a technical document, this diagram is incomplete. It serves only as a visual template of a network's shape. To be informative, it would require:
* A title defining the network's nature (e.g., "Server Network Topology," "Neural Network Layer," "Social Graph Cluster").
* Node labels or a legend explaining what the green circles represent.
* Edge labels or weights if the connections have varying properties.
* A key for any color coding (though only one color is used here).
**Conclusion for Technical Documentation:** This image provides a **structural template** of a complex network but contains **zero extractable factual data, labels, or textual information**. Its value is purely in illustrating the topology's shape—for a complete technical description, it must be accompanied by external explanatory text or labels that are not present in the image itself.