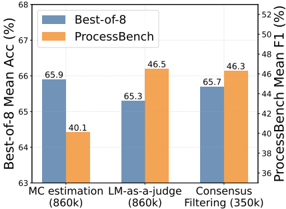
## Grouped Bar Chart: Comparison of Best-of-8 Mean Accuracy and ProcessBench Mean F1
### Overview
This chart compares the performance of three distinct filtering methods—"MC estimation," "LM-as-a-judge," and "Consensus Filtering"—across two performance metrics: "Best-of-8 Mean Acc (%)" and "ProcessBench Mean F1 (%)". The chart highlights the trade-offs in performance and data efficiency (indicated by the sample sizes in parentheses) for each method.
### Components/Axes
* **X-Axis (Categories):** Three methods are listed:
* "MC estimation (860k)"
* "LM-as-a-judge (860k)"
* "Consensus Filtering (350k)"
* **Left Y-Axis:** "Best-of-8 Mean Acc (%)". The scale ranges from 63 to 68.
* **Right Y-Axis:** "ProcessBench Mean F1 (%)". The scale ranges from 36 to 52.
* **Legend (Top-Left):**
* **Blue Bar:** Represents "Best-of-8" (corresponds to the Left Y-axis).
* **Orange Bar:** Represents "ProcessBench" (corresponds to the Right Y-axis).
### Detailed Analysis
The data is segmented by the three categories on the X-axis. Each category contains two bars: a blue bar for "Best-of-8" and an orange bar for "ProcessBench."
**1. MC estimation (860k)**
* **Best-of-8 (Blue):** 65.9
* **ProcessBench (Orange):** 40.1
* *Trend:* This category shows the highest Best-of-8 accuracy but the lowest ProcessBench F1 score.
**2. LM-as-a-judge (860k)**
* **Best-of-8 (Blue):** 65.3
* **ProcessBench (Orange):** 46.5
* *Trend:* Compared to MC estimation, the Best-of-8 accuracy drops slightly, while the ProcessBench F1 score increases significantly.
**3. Consensus Filtering (350k)**
* **Best-of-8 (Blue):** 65.7
* **ProcessBench (Orange):** 46.3
* *Trend:* This category maintains a high Best-of-8 accuracy (nearly matching MC estimation) while maintaining a high ProcessBench F1 score (nearly matching LM-as-a-judge).
### Key Observations
* **Data Efficiency:** "Consensus Filtering" achieves competitive results on both metrics while utilizing a significantly smaller dataset (350k) compared to the other two methods (860k).
* **Metric Divergence:** There is a clear divergence between the two metrics. "MC estimation" prioritizes "Best-of-8" accuracy at the expense of "ProcessBench" performance. Conversely, "LM-as-a-judge" and "Consensus Filtering" prioritize "ProcessBench" performance.
* **Stability:** The "Best-of-8" (Blue) metric is relatively stable across all three methods, fluctuating only within a narrow range (65.3 to 65.9). The "ProcessBench" (Orange) metric shows higher volatility, with a sharp increase from the first method to the second and third.
### Interpretation
The data demonstrates that "Consensus Filtering" is the most efficient method among those presented. It effectively balances the performance characteristics of the other two methods. While "MC estimation" is superior for "Best-of-8" accuracy, it fails to perform well on "ProcessBench." "LM-as-a-judge" performs well on "ProcessBench" but requires a much larger dataset (860k) to achieve results comparable to "Consensus Filtering" (350k). Therefore, "Consensus Filtering" appears to be the optimal choice for maximizing performance metrics while minimizing data requirements.