\n
## Bar Chart: Performance Comparison of Different Methods
### Overview
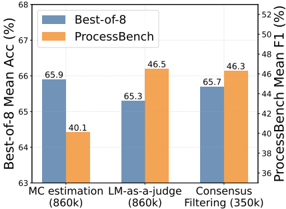
This bar chart compares the performance of three different methods – MC estimation, LM-as-a-judge, and Consensus Filtering – using two metrics: Best-of-8 Mean Accuracy (%) and ProcessBench Mean F1 (%). Each method is represented by two bars, one for each metric. The chart allows for a direct comparison of how each method performs on both metrics.
### Components/Axes
* **X-axis:** Represents the three methods being compared: "MC estimation (860k)", "LM-as-a-judge (860k)", and "Consensus Filtering (350k)". The number in parentheses indicates the model size (in thousands of parameters).
* **Left Y-axis:** "Best-of-8 Mean Acc (%)" - Scale ranges from approximately 63% to 68%.
* **Right Y-axis:** "ProcessBench Mean F1 (%)" - Scale ranges from approximately 36% to 52%.
* **Legend:** Located in the top-left corner.
* Blue: "Best-of-8"
* Orange: "ProcessBench"
### Detailed Analysis
The chart consists of six bars, grouped by method.
* **MC estimation (860k):**
* Best-of-8: Approximately 65.9% (Blue bar)
* ProcessBench: Approximately 40.1% (Orange bar)
* **LM-as-a-judge (860k):**
* Best-of-8: Approximately 65.3% (Blue bar)
* ProcessBench: Approximately 46.5% (Orange bar)
* **Consensus Filtering (350k):**
* Best-of-8: Approximately 65.7% (Blue bar)
* ProcessBench: Approximately 46.3% (Orange bar)
The blue bars (Best-of-8) are relatively consistent across all three methods, hovering around 65-66%. The orange bars (ProcessBench) show more variation.
### Key Observations
* MC estimation has the lowest ProcessBench score (40.1%).
* LM-as-a-judge and Consensus Filtering have similar ProcessBench scores (46.5% and 46.3% respectively).
* The model size appears to have little impact on Best-of-8 accuracy, as the 860k models (MC estimation and LM-as-a-judge) perform similarly to the 350k model (Consensus Filtering).
* ProcessBench scores are significantly lower than Best-of-8 scores for all methods.
### Interpretation
The data suggests that while all three methods achieve comparable performance on the Best-of-8 metric, they differ significantly in their performance on the ProcessBench metric. MC estimation performs notably worse on ProcessBench compared to the other two methods. The fact that Consensus Filtering achieves a comparable ProcessBench score to LM-as-a-judge, despite being a smaller model (350k vs 860k), is interesting and suggests that it may be a more efficient method. The large discrepancy between the two metrics indicates that the methods are evaluating different aspects of performance, or that the metrics themselves are measuring different things. The Best-of-8 metric may be more sensitive to overall quality, while ProcessBench may be more sensitive to specific types of errors or challenges. The difference in model size does not appear to be a major factor in Best-of-8 accuracy, but it could be influencing the ProcessBench scores. Further investigation would be needed to understand the underlying reasons for these differences.