## Dual-Axis Bar Chart: Performance Comparison of Three Methods
### Overview
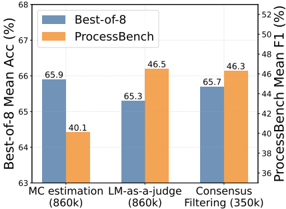
This image is a dual-axis bar chart comparing the performance of three different methods across two distinct metrics. The chart uses a grouped bar format, with each method represented by two adjacent bars of different colors, each corresponding to a different performance metric measured on separate y-axes.
### Components/Axes
* **Chart Type:** Grouped Bar Chart with Dual Y-Axes.
* **X-Axis (Categories):** Three methods are listed from left to right:
1. `MC estimation (860k)`
2. `LM-as-a-judge (860k)`
3. `Consensus Filtering (350k)`
* **Primary Y-Axis (Left):**
* **Label:** `Best-of-8 Mean Acc (%)`
* **Scale:** Linear scale ranging from 63 to 68, with major tick marks at 63, 64, 65, 66, 67, and 68.
* **Secondary Y-Axis (Right):**
* **Label:** `ProcessBench Mean F1 (%)`
* **Scale:** Linear scale ranging from 36 to 52, with major tick marks at 36, 38, 40, 42, 44, 46, 48, 50, and 52.
* **Legend:** Located in the top-left corner of the chart area.
* A blue square is labeled `Best-of-8`.
* An orange square is labeled `ProcessBench`.
* **Data Labels:** Numerical values are printed directly above each bar.
### Detailed Analysis
The chart presents data for three methods, with each method having a blue bar (Best-of-8 Accuracy) and an orange bar (ProcessBench F1 Score).
**1. MC estimation (860k)**
* **Best-of-8 (Blue Bar):** The bar is the tallest among the blue bars. Its value is labeled as **65.9**. This indicates a high mean accuracy for the Best-of-8 metric.
* **ProcessBench (Orange Bar):** The bar is the shortest among the orange bars. Its value is labeled as **40.1**. This indicates a relatively low F1 score for the ProcessBench metric.
* **Trend:** This method shows a strong performance on the Best-of-8 metric but the weakest performance on the ProcessBench metric.
**2. LM-as-a-judge (860k)**
* **Best-of-8 (Blue Bar):** The bar is the shortest among the blue bars. Its value is labeled as **65.3**.
* **ProcessBench (Orange Bar):** The bar is the tallest among the orange bars. Its value is labeled as **46.5**.
* **Trend:** This method shows the opposite pattern to MC estimation: the lowest Best-of-8 accuracy but the highest ProcessBench F1 score.
**3. Consensus Filtering (350k)**
* **Best-of-8 (Blue Bar):** The bar's height is intermediate between the other two blue bars. Its value is labeled as **65.7**.
* **ProcessBench (Orange Bar):** The bar's height is slightly lower than the tallest orange bar. Its value is labeled as **46.3**.
* **Trend:** This method demonstrates balanced performance, with the second-highest score on both metrics. It uses a smaller dataset (350k) compared to the other two methods (860k).
### Key Observations
1. **Inverse Relationship:** There is a clear inverse relationship between the two metrics across the first two methods. The method with the highest Best-of-8 accuracy (MC estimation) has the lowest ProcessBench F1 score, and vice-versa (LM-as-a-judge).
2. **Consensus Filtering's Balance:** Consensus Filtering achieves a middle ground, sacrificing a small amount of Best-of-8 accuracy (0.2% less than MC estimation) for a significant gain in ProcessBench F1 score (+6.2 points over MC estimation).
3. **Dataset Size Note:** The labels indicate the dataset size used for each method. The first two methods used 860k samples, while Consensus Filtering used only 350k samples, suggesting it may be more data-efficient for the ProcessBench metric.
4. **Metric Sensitivity:** The performance ranking of the methods is completely different depending on which metric is used for evaluation.
### Interpretation
This chart illustrates a classic trade-off in model evaluation or system design. The "Best-of-8 Mean Accuracy" and "ProcessBench Mean F1 Score" appear to be measuring different, potentially conflicting, aspects of performance.
* **MC estimation** excels at the task measured by Best-of-8 accuracy (possibly a multiple-choice or selection-based task) but performs poorly on the ProcessBench metric (which likely evaluates a process, reasoning chain, or step-by-step output quality via F1 score).
* **LM-as-a-judge** shows the reverse pattern, suggesting it is better at generating or evaluating process-oriented outputs (high F1) but less reliable at the specific selection task measured by Best-of-8.
* **Consensus Filtering** represents a potential compromise. Its name suggests it aggregates multiple outputs to filter for consensus, which may help stabilize performance across different evaluation criteria. Notably, it achieves near-peak performance on both metrics while using less than half the data of the other methods, indicating potential efficiency and robustness.
The data suggests that the choice of method should be driven by the primary objective: if raw accuracy on a selection task is paramount, MC estimation is best. If the quality of an intermediate process is critical, LM-as-a-judge is superior. If a balance of both is needed, or if data efficiency is a concern, Consensus Filtering appears to be the most robust and efficient choice. The stark difference in rankings underscores the importance of using multiple, complementary metrics for comprehensive evaluation.