# Technical Document Analysis of Bar Chart
## Chart Overview
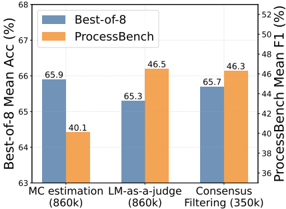
The image is a **bar chart** comparing the performance of two methods, **Best-of-8** and **ProcessBench**, across three tasks: **MC estimation**, **LM-as-a-judge**, and **Consensus Filtering**. The chart uses dual y-axes to represent two metrics: **Best-of-8 Mean Accuracy (%)** (left) and **ProcessBench Mean F1 (%)** (right).
---
## Key Components
### 1. **Axes and Labels**
- **X-axis**:
- Categories:
- **MC estimation (860k)**
- **LM-as-a-judge (860k)**
- **Consensus Filtering (350k)**
- Labels are centered under each bar.
- **Y-axis (Left)**:
- Title: **Best-of-8 Mean Acc (%)**
- Range: 63% to 68%
- **Y-axis (Right)**:
- Title: **ProcessBench Mean F1 (%)**
- Range: 36% to 52%
### 2. **Legend**
- **Position**: Top-right corner of the chart.
- **Labels**:
- **Best-of-8**: Blue bars
- **ProcessBench**: Orange bars
### 3. **Data Points**
| Task | Best-of-8 (Accuracy %) | ProcessBench (F1 %) |
|-----------------------|------------------------|----------------------|
| MC estimation (860k) | 65.9 | 40.1 |
| LM-as-a-judge (860k) | 65.3 | 46.5 |
| Consensus Filtering (350k) | 65.7 | 46.3 |
---
## Trends and Observations
1. **Best-of-8 Performance**:
- Consistently high accuracy across all tasks, ranging from **65.3% to 65.9%**.
- No significant variation between tasks.
2. **ProcessBench Performance**:
- Lower F1 scores compared to Best-of-8, ranging from **40.1% to 46.5%**.
- **Highest F1 score** in **LM-as-a-judge (46.5%)**, followed by **Consensus Filtering (46.3%)**.
- **Lowest F1 score** in **MC estimation (40.1%)**.
3. **Comparison**:
- Best-of-8 outperforms ProcessBench in all tasks, with the largest gap in **MC estimation (65.9% vs. 40.1%)**.
- ProcessBench shows slightly better performance in **LM-as-a-judge** and **Consensus Filtering** compared to MC estimation.
---
## Spatial Grounding
- **Legend**: Top-right corner (standard placement for bar charts).
- **X-axis Labels**: Centered under each bar.
- **Y-axes**: Left (Best-of-8) and right (ProcessBench) for dual-axis representation.
---
## Notes
- No non-English text is present in the chart.
- All data points are explicitly labeled on the bars.
- The chart uses a **dual-axis design** to compare two distinct metrics (accuracy vs. F1 score) across the same tasks.