## Line Graphs: Sentence Probability Comparison Across Models
### Overview
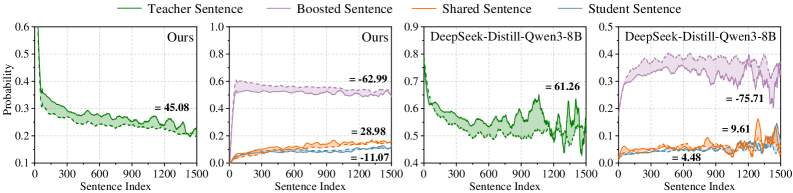
The image contains four line graphs comparing sentence probabilities across two models: "Ours" (top row) and "DeepSeek-Distill-Qwen3-8B" (bottom row). Each graph tracks four sentence types (Teacher, Boosted, Shared, Student) over 1,500 sentences. Probabilities are plotted on the y-axis (0.1–0.9), while the x-axis represents sentence indices (0–1,500). Legends in the top-right corner of each graph map colors to sentence types.
### Components/Axes
- **X-axis**: "Sentence Index" (0–1,500)
- **Y-axis**: "Probability" (0.1–0.9 for top graphs, 0.0–0.5 for bottom graphs)
- **Legends**:
- Green: Teacher Sentence
- Purple: Boosted Sentence
- Orange: Shared Sentence
- Blue: Student Sentence
- **Graph Layout**: 2x2 grid (top-left: "Ours" Teacher/Boosted/Shared/Student; top-right: "Ours" Teacher/Boosted/Shared/Student; bottom-left: "DeepSeek-Distill-Qwen3-8B" Teacher/Boosted/Shared/Student; bottom-right: "DeepSeek-Distill-Qwen3-8B" Teacher/Boosted/Shared/Student).
### Detailed Analysis
#### Top-Left Graph ("Ours")
- **Teacher Sentence (Green)**: Starts at ~0.6, decreases steadily to ~0.45 (value: **45.08**).
- **Boosted Sentence (Purple)**: Starts at ~0.3, rises slightly, then drops sharply to **-62.99**.
- **Shared Sentence (Orange)**: Remains near 0.1–0.2, ending at **28.98**.
- **Student Sentence (Blue)**: Fluctuates between 0.05–0.15, ending at **-11.07**.
#### Top-Right Graph ("Ours")
- **Teacher Sentence (Green)**: Starts at ~0.6, decreases to ~0.45 (value: **45.08**).
- **Boosted Sentence (Purple)**: Starts at ~0.3, rises slightly, then drops to **-62.99**.
- **Shared Sentence (Orange)**: Stays near 0.1–0.2, ending at **28.98**.
- **Student Sentence (Blue)**: Fluctuates between 0.05–0.15, ending at **-11.07**.
#### Bottom-Left Graph ("DeepSeek-Distill-Qwen3-8B")
- **Teacher Sentence (Green)**: Starts at ~0.8, decreases to ~0.6 (value: **61.26**).
- **Boosted Sentence (Purple)**: Starts at ~0.4, rises slightly, then drops sharply to **-75.71**.
- **Shared Sentence (Orange)**: Remains near 0.1–0.2, ending at **9.61**.
- **Student Sentence (Blue)**: Fluctuates between 0.05–0.15, ending at **4.48**.
#### Bottom-Right Graph ("DeepSeek-Distill-Qwen3-8B")
- **Teacher Sentence (Green)**: Starts at ~0.8, decreases to ~0.6 (value: **61.26**).
- **Boosted Sentence (Purple)**: Starts at ~0.4, rises slightly, then drops to **-75.71**.
- **Shared Sentence (Orange)**: Stays near 0.1–0.2, ending at **9.61**.
- **Student Sentence (Blue)**: Fluctuates between 0.05–0.15, ending at **4.48**.
### Key Observations
1. **Teacher Sentences**:
- Both models show a gradual decline in probability over sentences.
- "DeepSeek-Distill-Qwen3-8B" starts with higher probabilities (~0.8 vs. ~0.6) but ends lower (~61.26 vs. 45.08).
2. **Boosted Sentences**:
- Both models exhibit a sharp negative drop in later sentences (e.g., **-62.99** in "Ours", **-75.71** in "DeepSeek-Distill-Qwen3-8B").
- This suggests a potential instability or anomaly in the model's handling of Boosted Sentences.
3. **Shared vs. Student Sentences**:
- Shared Sentences consistently outperform Student Sentences in probability.
- Student Sentences show the lowest probabilities, with negative values in "Ours" (-11.07) and positive but low values in "DeepSeek-Distill-Qwen3-8B" (4.48).
### Interpretation
- **Model Performance**:
- "Ours" maintains higher probabilities for Teacher and Shared Sentences compared to "DeepSeek-Distill-Qwen3-8B", which shows a steeper decline in Teacher Sentence probabilities.
- The negative values for Boosted and Student Sentences in "Ours" may indicate model limitations or data preprocessing issues.
- **Sentence Type Dynamics**:
- Teacher Sentences dominate early but degrade over time, suggesting diminishing model confidence.
- Boosted Sentences’ sharp negative drop could reflect overfitting or adversarial examples.
- Shared Sentences’ stability implies robustness, while Student Sentences’ low probabilities highlight challenges in generating coherent outputs.
- **Anomalies**:
- Negative probabilities (e.g., **-62.99**, **-75.71**) are statistically invalid but may represent model errors or miscalibrations.
- The divergence in Student Sentence performance between models suggests differing training objectives or architectures.