TECHNICAL ASSET FINGERPRINT
c8811b1d52b1bb9fc3b1d347
Click to view fullscreen
Press ESC or click to close
FOUND IN PAPERS
EXPERT: gemma-3-27b-it-free VERSION 1
RUNTIME: google-free/gemma-3-27b-it
INTEL_VERIFIED
\n
## Chart: Probability vs. Sentence Index for Different Training Methods
### Overview
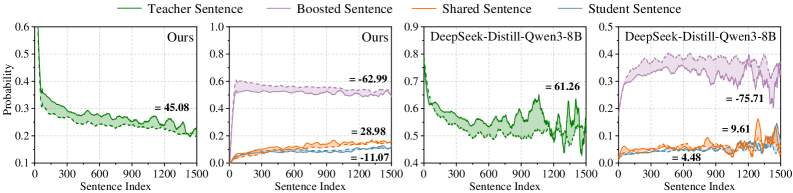
The image presents four line charts, each depicting the probability distribution across sentence indices for different training methods. The x-axis represents the sentence index, ranging from 0 to 1500. The y-axis represents the probability, ranging from approximately 0.0 to 0.8. Each chart displays four lines representing "Teacher Sentence", "Boosted Sentence", "Shared Sentence", and "Student Sentence". Each chart also includes a numerical value indicating a calculated metric (likely correlation or similarity) associated with the data.
### Components/Axes
* **X-axis:** Sentence Index (0 to 1500)
* **Y-axis:** Probability (0.0 to 0.8)
* **Legend:**
* Teacher Sentence (Green, solid line)
* Boosted Sentence (Purple, dashed line)
* Shared Sentence (Orange, dotted line)
* Student Sentence (Blue, solid line)
* **Chart Titles:**
* Chart 1: "Ours"
* Chart 2: "Ours"
* Chart 3: "DeepSeek-Distill-Qwen-3-8B"
* Chart 4: "DeepSeek-Distill-Qwen-8B"
* **Numerical Values:** Each chart displays a single numerical value near the end of the x-axis, likely representing a correlation or similarity score.
### Detailed Analysis or Content Details
**Chart 1: "Ours"**
* **Teacher Sentence (Green):** The line starts at approximately 0.55 and slopes downward, reaching approximately 0.20 at sentence index 1500. The value at sentence index 1200 is approximately 0.45.
* **Boosted Sentence (Purple):** The line starts at approximately 0.75 and remains relatively stable, fluctuating around 0.70 throughout the sentence indices. The value at sentence index 1200 is approximately 0.63.
* **Shared Sentence (Orange):** The line starts at approximately 0.15 and slopes upward, reaching approximately 0.29 at sentence index 1500. The value at sentence index 1200 is approximately 0.28.
* **Student Sentence (Blue):** The line starts at approximately 0.10 and slopes upward, reaching approximately 0.12 at sentence index 1500. The value at sentence index 1200 is approximately 0.11.
* **Numerical Value:** +45.08
**Chart 2: "Ours"**
* **Teacher Sentence (Green):** The line starts at approximately 0.75 and slopes downward, reaching approximately 0.55 at sentence index 1500. The value at sentence index 1200 is approximately 0.63.
* **Boosted Sentence (Purple):** The line remains relatively flat, starting at approximately 0.78 and fluctuating around 0.75. The value at sentence index 1200 is approximately 0.73.
* **Shared Sentence (Orange):** The line starts at approximately 0.05 and slopes upward, reaching approximately 0.12 at sentence index 1500. The value at sentence index 1200 is approximately 0.11.
* **Student Sentence (Blue):** The line starts at approximately 0.02 and slopes upward, reaching approximately 0.05 at sentence index 1500. The value at sentence index 1200 is approximately 0.04.
* **Numerical Value:** +62.99
**Chart 3: "DeepSeek-Distill-Qwen-3-8B"**
* **Teacher Sentence (Green):** The line starts at approximately 0.70 and slopes downward, reaching approximately 0.50 at sentence index 1500. The value at sentence index 1200 is approximately 0.61.
* **Boosted Sentence (Purple):** The line remains relatively flat, starting at approximately 0.75 and fluctuating around 0.70. The value at sentence index 1200 is approximately 0.70.
* **Shared Sentence (Orange):** The line starts at approximately 0.05 and slopes upward, reaching approximately 0.10 at sentence index 1500. The value at sentence index 1200 is approximately 0.09.
* **Student Sentence (Blue):** The line starts at approximately 0.04 and slopes upward, reaching approximately 0.06 at sentence index 1500. The value at sentence index 1200 is approximately 0.05.
* **Numerical Value:** +61.26
**Chart 4: "DeepSeek-Distill-Qwen-8B"**
* **Teacher Sentence (Green):** The line starts at approximately 0.65 and slopes downward, reaching approximately 0.45 at sentence index 1500. The value at sentence index 1200 is approximately 0.55.
* **Boosted Sentence (Purple):** The line remains relatively flat, starting at approximately 0.70 and fluctuating around 0.65. The value at sentence index 1200 is approximately 0.65.
* **Shared Sentence (Orange):** The line starts at approximately 0.04 and slopes upward, reaching approximately 0.08 at sentence index 1500. The value at sentence index 1200 is approximately 0.07.
* **Student Sentence (Blue):** The line starts at approximately 0.04 and slopes upward, reaching approximately 0.07 at sentence index 1500. The value at sentence index 1200 is approximately 0.05.
* **Numerical Value:** -75.71
### Key Observations
* The "Teacher Sentence" consistently shows a decreasing probability trend across all charts.
* The "Boosted Sentence" generally maintains a higher and more stable probability compared to the other sentences.
* The "Shared Sentence" and "Student Sentence" exhibit similar upward trends, but with significantly lower probability values.
* The numerical values vary significantly across the charts, suggesting different performance levels for each training method.
* Chart 4 ("DeepSeek-Distill-Qwen-8B") has a negative numerical value, indicating a potentially inverse relationship or poor correlation.
### Interpretation
The charts likely represent the probability distribution of sentence embeddings or representations learned during different training paradigms. The "Teacher Sentence" represents the original, high-quality data, while the "Student Sentence" represents the learned representation. The "Boosted Sentence" and "Shared Sentence" likely represent intermediate stages or components of the training process.
The decreasing trend of the "Teacher Sentence" could indicate a loss of information or a shift in the representation space as the sentence index increases. The stable "Boosted Sentence" suggests that the boosting mechanism effectively preserves information. The upward trends of the "Shared Sentence" and "Student Sentence" indicate that the model is learning to represent the data, but the low probability values suggest that the learned representations are still significantly different from the original data.
The varying numerical values likely represent a correlation or similarity score between the "Teacher Sentence" and the other sentences. The negative value in Chart 4 suggests that the "DeepSeek-Distill-Qwen-8B" model is learning representations that are dissimilar to the original data, potentially indicating a problem with the training process or model architecture. The charts demonstrate the impact of different training methods on the quality and similarity of learned sentence representations.
DECODING INTELLIGENCE...