## Line Chart: Number of Packages Matched by Heuristic Over Time
### Overview
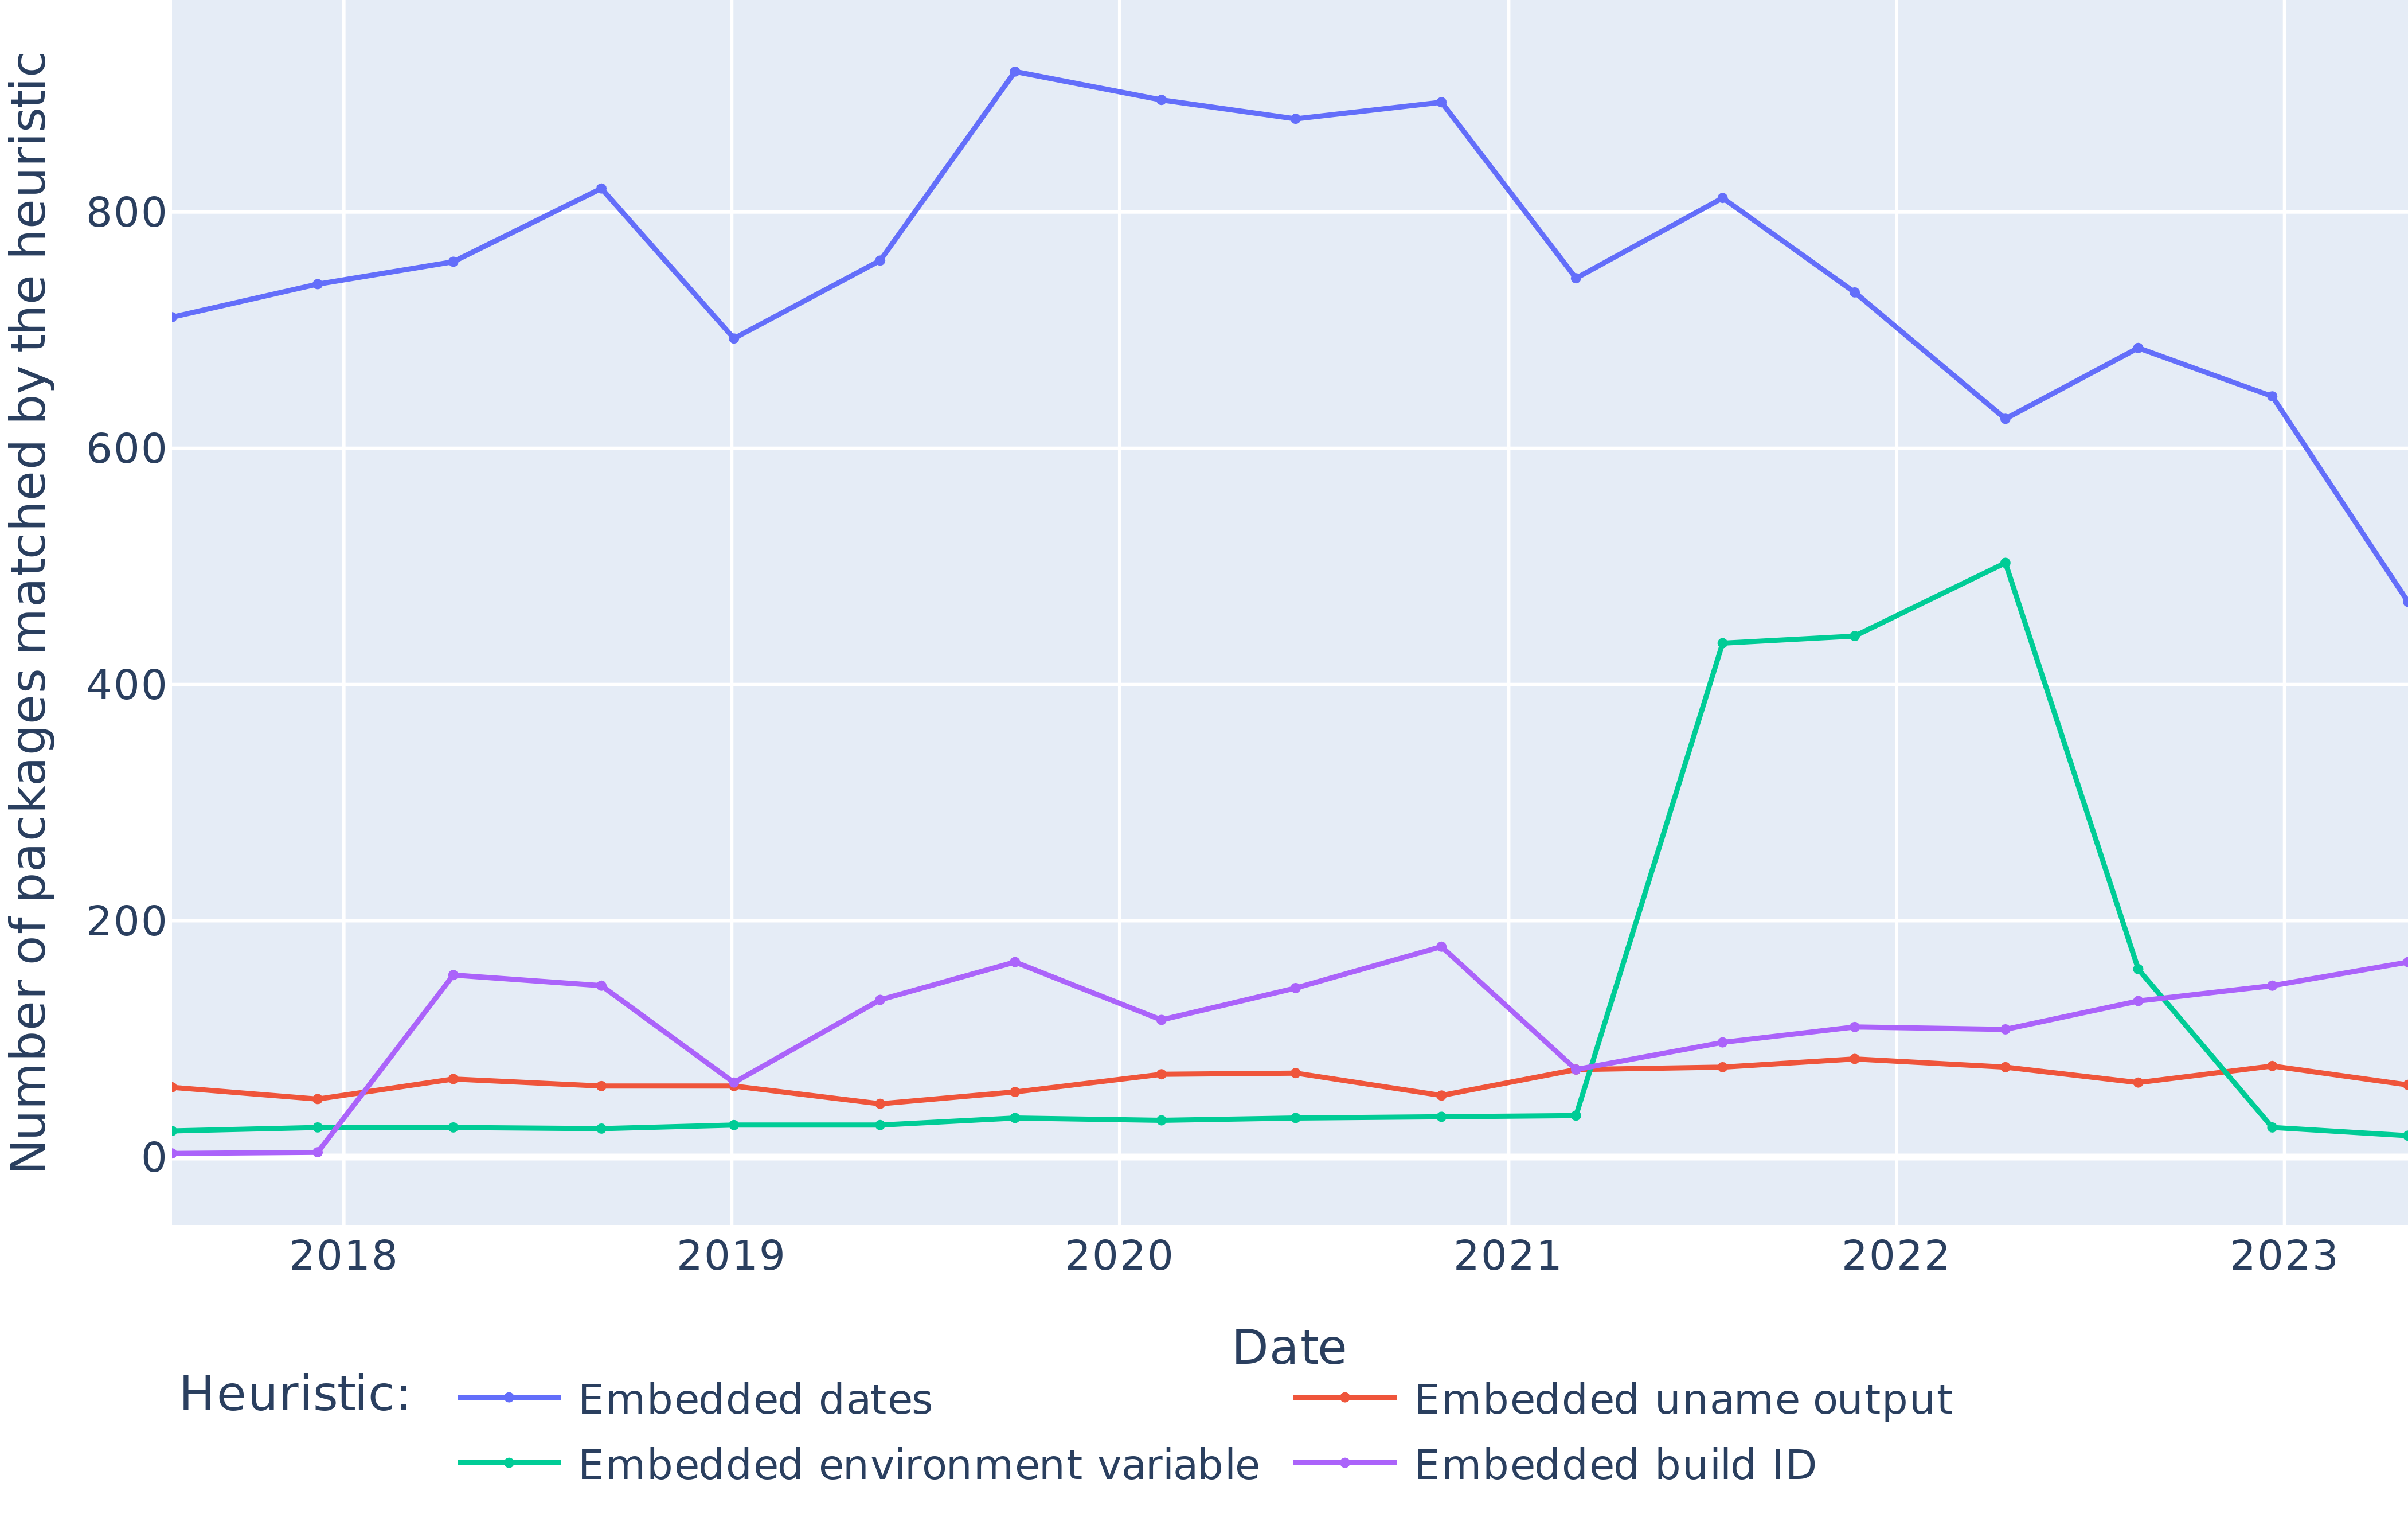
The image is a line chart showing the number of packages matched by different heuristics over time, from 2017 to 2023. The y-axis represents the number of packages, and the x-axis represents the date. There are four lines, each representing a different heuristic: "Embedded dates" (blue), "Embedded uname output" (red), "Embedded environment variable" (green), and "Embedded build ID" (purple).
### Components/Axes
* **Title:** "Number of packages matched by the heuristic" (y-axis)
* **X-axis:** "Date"
* **X-axis Markers:** 2018, 2019, 2020, 2021, 2022, 2023
* **Y-axis:** "Number of packages matched by the heuristic"
* **Y-axis Markers:** 0, 200, 400, 600, 800
* **Legend:** Located at the bottom of the chart.
* **Embedded dates:** (blue line)
* **Embedded uname output:** (red line)
* **Embedded environment variable:** (green line)
* **Embedded build ID:** (purple line)
### Detailed Analysis
* **Embedded dates (blue line):** This line starts at approximately 720 in 2017, increases to approximately 750 in 2018, then to 820 in 2019. It decreases to approximately 700 in 2019, then increases sharply to approximately 920 in 2020. It remains high at approximately 900 in 2021, then drops to approximately 750 in 2021. It decreases to approximately 620 in 2022, then increases to approximately 680 in 2023, before dropping to approximately 480 in 2023.
* **Embedded uname output (red line):** This line remains relatively flat throughout the period. It starts at approximately 60 in 2017, increases to approximately 70 in 2018, then decreases to approximately 60 in 2019. It increases slightly to approximately 70 in 2020, then decreases to approximately 60 in 2021. It increases to approximately 80 in 2022, then decreases to approximately 70 in 2023, before decreasing to approximately 60 in 2023.
* **Embedded environment variable (green line):** This line remains relatively flat until 2021, then increases sharply. It starts at approximately 30 in 2017, remains at approximately 30 in 2018, then decreases to approximately 20 in 2019. It remains at approximately 30 in 2020 and 2021, then increases sharply to approximately 440 in 2022. It increases slightly to approximately 500 in 2022, then decreases sharply to approximately 80 in 2023, before decreasing to approximately 20 in 2023.
* **Embedded build ID (purple line):** This line increases from 2017 to 2020, then decreases slightly before increasing again. It starts at approximately 10 in 2017, increases to approximately 150 in 2018, then remains at approximately 150 in 2019. It increases to approximately 160 in 2020, then decreases to approximately 120 in 2021. It increases to approximately 180 in 2021, then decreases to approximately 110 in 2022. It increases to approximately 140 in 2023, before increasing to approximately 160 in 2023.
### Key Observations
* The "Embedded dates" heuristic consistently matches the highest number of packages.
* The "Embedded uname output" heuristic consistently matches the lowest number of packages.
* The "Embedded environment variable" heuristic shows a significant spike in 2021 and 2022.
### Interpretation
The chart illustrates the prevalence of different types of embedded information within software packages over time. The "Embedded dates" heuristic consistently identifies the most packages, suggesting that date information is commonly included. The spike in "Embedded environment variable" matches in 2021 and 2022 could indicate a change in coding practices or an increased reliance on environment variables during those years. The relatively low and stable number of matches for "Embedded uname output" suggests that this type of information is less frequently embedded in packages. The "Embedded build ID" heuristic shows a gradual increase over time, suggesting that build IDs are becoming more common in software packages.