## Line Chart: Packages Matched by Heuristic Over Time
### Overview
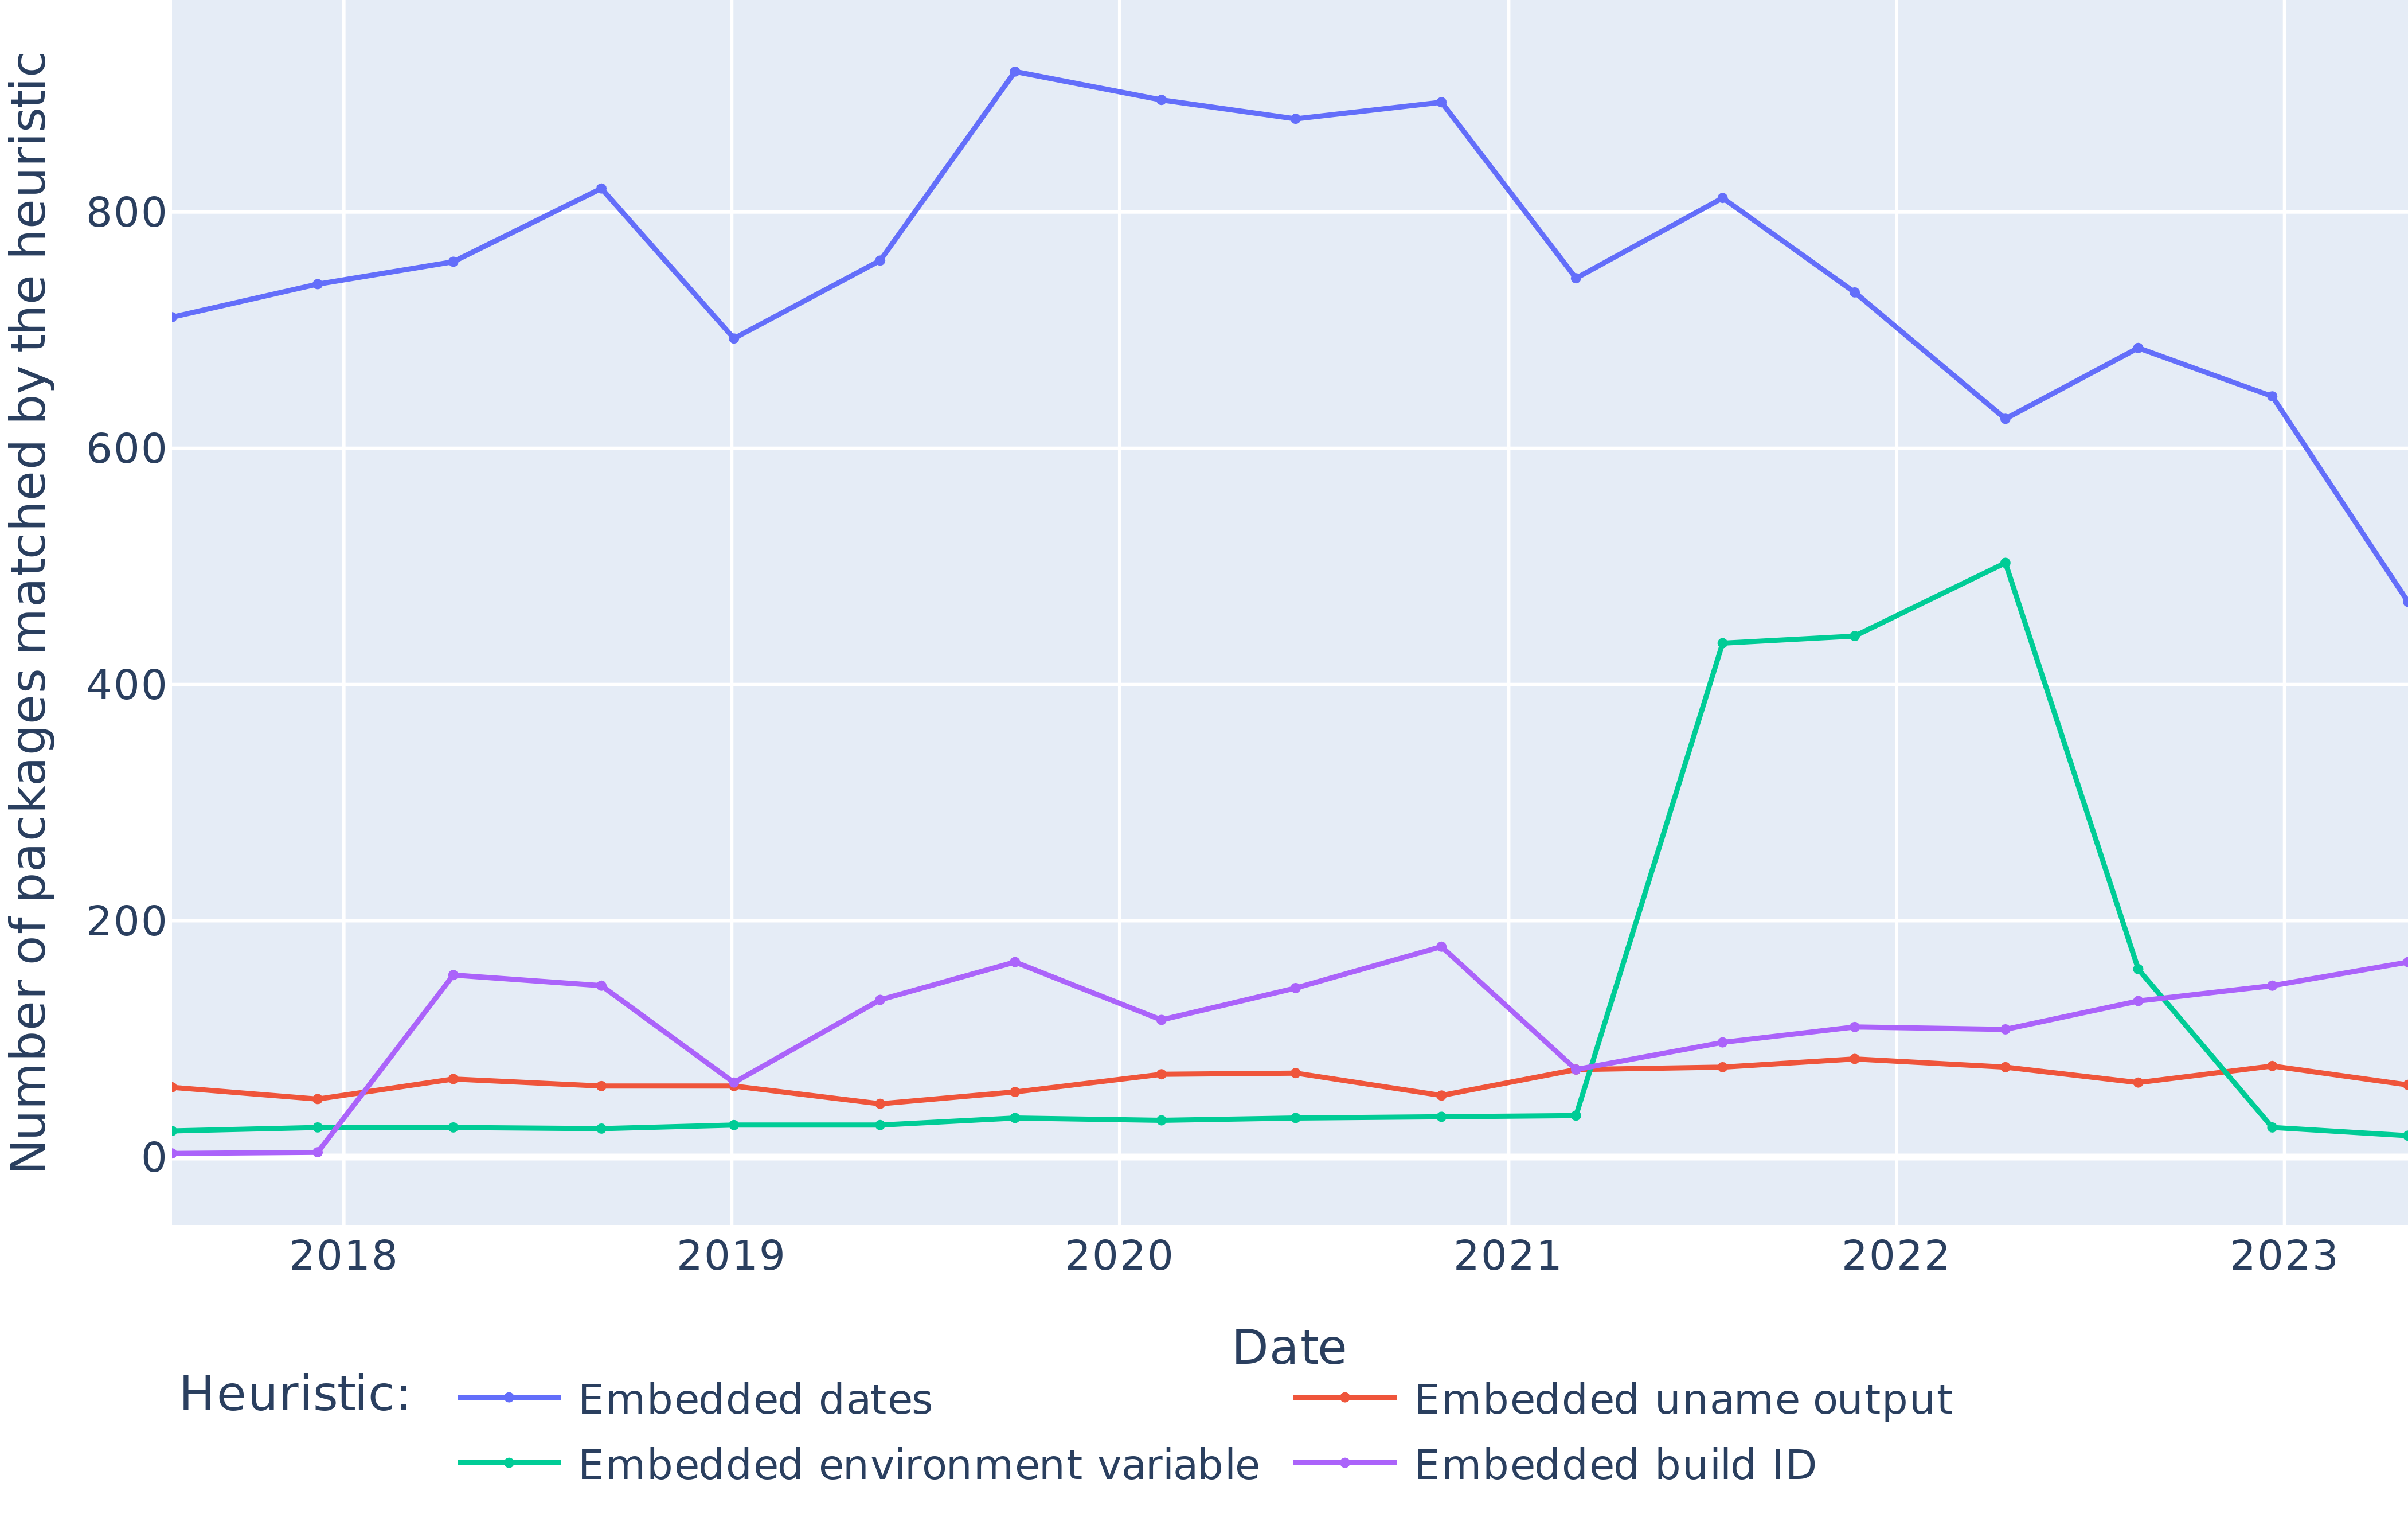
This line chart displays the number of packages matched by different heuristics over the period from 2018 to 2023. Four heuristics are compared: Embedded dates, Embedded uname output, Embedded environment variable, and Embedded build ID. The y-axis represents the number of packages matched, while the x-axis represents the date.
### Components/Axes
* **X-axis Title:** Date
* **Y-axis Title:** Number of packages matched by the heuristic
* **Legend:** Located at the bottom-center of the chart.
* Embedded dates (Purple line)
* Embedded uname output (Orange line)
* Embedded environment variable (Green line)
* Embedded build ID (Blue line)
* **X-axis Markers:** 2018, 2019, 2020, 2021, 2022, 2023
* **Y-axis Scale:** Approximately 0 to 900, with increments of 100.
### Detailed Analysis
* **Embedded dates (Purple Line):** This line generally slopes upward from 2018 to 2020, peaking at approximately 880 in 2020. It then declines to around 750 in 2021, rises again to approximately 820 in 2022, and then sharply drops to around 450 in 2023.
* 2018: ~740
* 2019: ~780
* 2020: ~880
* 2021: ~750
* 2022: ~820
* 2023: ~450
* **Embedded uname output (Orange Line):** This line remains relatively flat throughout the period, fluctuating between approximately 20 and 80. It shows a slight dip around 2021.
* 2018: ~40
* 2019: ~50
* 2020: ~40
* 2021: ~20
* 2022: ~60
* 2023: ~30
* **Embedded environment variable (Green Line):** This line shows a significant increase from 2021 to 2022, rising from approximately 100 to 450. It then decreases to around 200 in 2023.
* 2018: ~100
* 2019: ~150
* 2020: ~100
* 2021: ~100
* 2022: ~450
* 2023: ~200
* **Embedded build ID (Blue Line):** This line exhibits a generally upward trend from 2018 to 2022, starting at approximately 700 and reaching a peak of around 850 in 2022. It then experiences a substantial decline to approximately 650 in 2023.
* 2018: ~700
* 2019: ~750
* 2020: ~800
* 2021: ~780
* 2022: ~850
* 2023: ~650
### Key Observations
* The "Embedded dates" and "Embedded build ID" heuristics consistently match a significantly higher number of packages compared to the other two.
* The "Embedded environment variable" heuristic shows a dramatic increase in matched packages in 2022, followed by a decrease in 2023.
* The "Embedded uname output" heuristic remains relatively stable with a low number of matches.
* 2023 shows a significant drop in matches for "Embedded dates" and "Embedded build ID".
### Interpretation
The chart demonstrates the effectiveness of different heuristics in matching packages over time. The consistently high number of matches for "Embedded dates" and "Embedded build ID" suggests these are reliable indicators. The sudden increase in "Embedded environment variable" matches in 2022 could indicate a change in how packages are built or labeled, or a refinement in the heuristic itself. The sharp decline in matches for "Embedded dates" and "Embedded build ID" in 2023 is a notable anomaly that warrants further investigation. It could be due to changes in package metadata, updates to the matching algorithm, or a shift in the package landscape. The relatively low and stable matches for "Embedded uname output" suggest this heuristic is less effective or applicable to the majority of packages. The data suggests a dynamic relationship between the heuristics and the packages they are attempting to match, highlighting the need for continuous monitoring and adaptation of these methods.