## Line Chart: Number of Packages Matched by Heuristic Over Time
### Overview
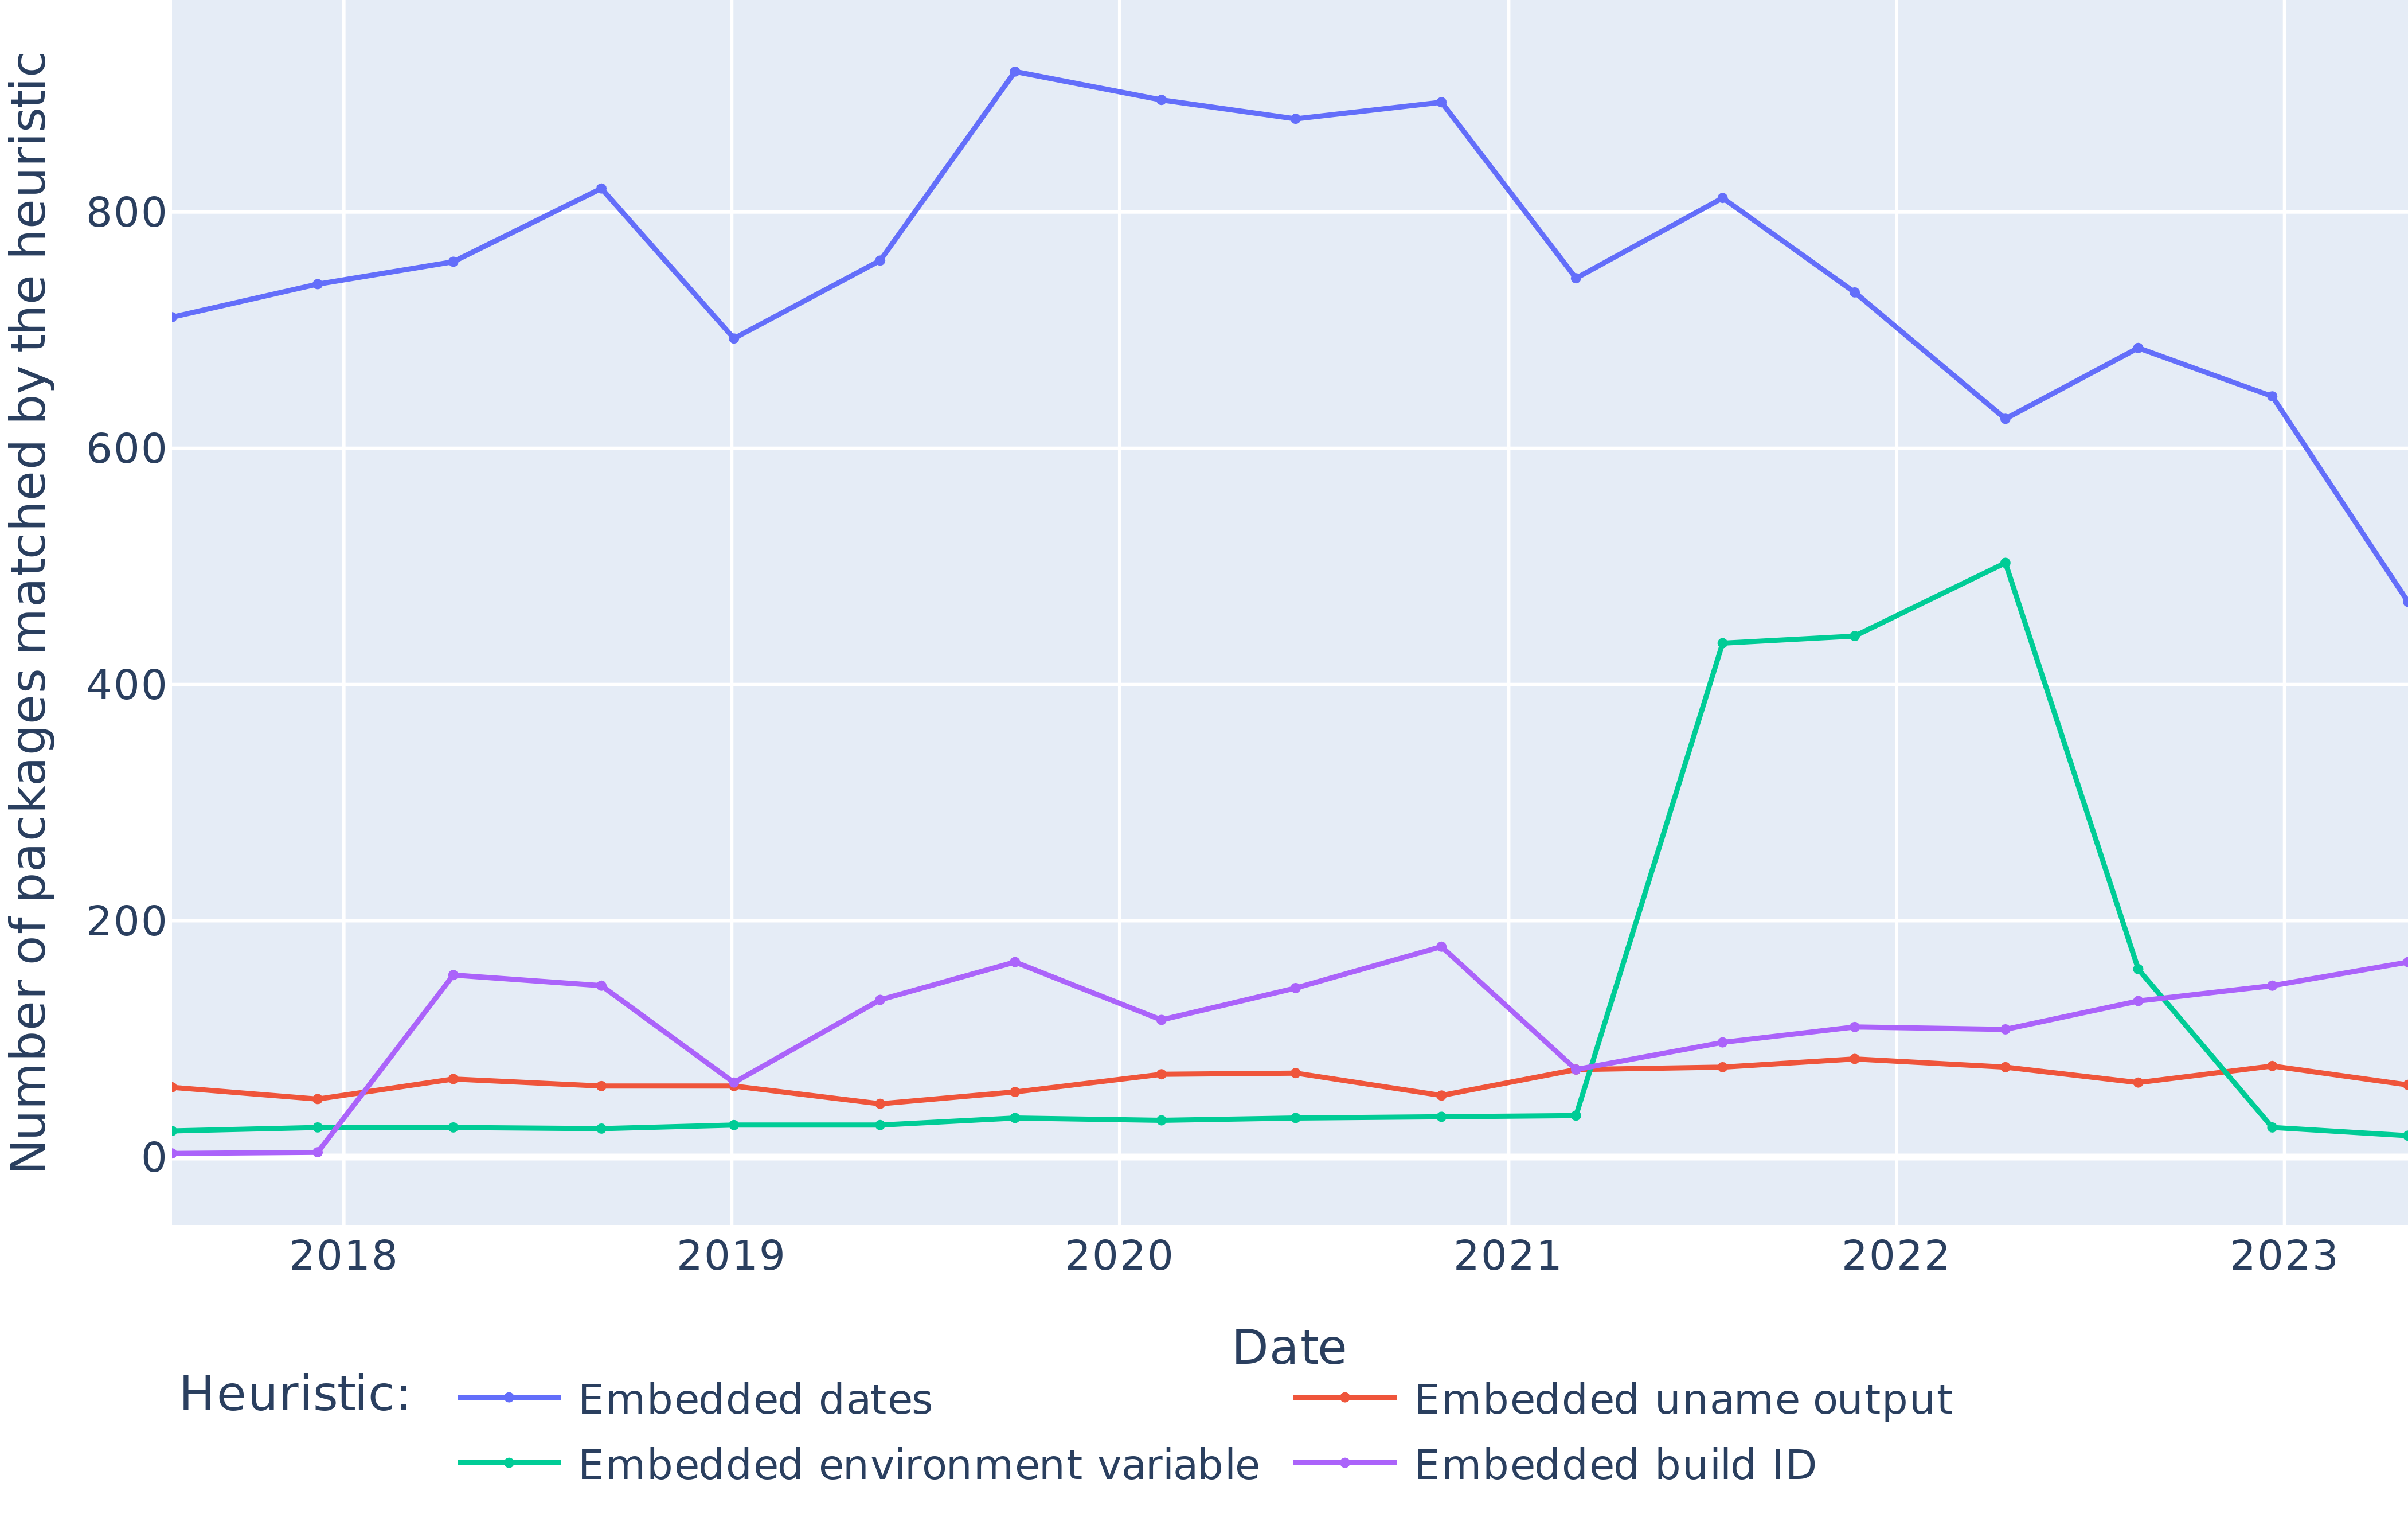
The chart displays four time-series data lines representing different heuristics used to match packages over a six-year period (2018–2023). The y-axis measures the number of packages matched, while the x-axis tracks chronological progression. Four distinct heuristics are visualized with unique colors and trends.
### Components/Axes
- **X-axis (Date)**: Labeled "Date" with annual markers from 2018 to 2023.
- **Y-axis (Number of packages matched by the heuristic)**: Labeled with increments of 200, ranging from 0 to 1000.
- **Legend**: Located at the bottom, with four entries:
- **Blue**: Embedded dates
- **Red**: Embedded uname output
- **Green**: Embedded environment variable
- **Purple**: Embedded build ID
### Detailed Analysis
1. **Embedded dates (Blue line)**:
- Starts at ~700 packages in 2018.
- Peaks at ~900 packages in 2020.
- Declines sharply to ~500 packages by 2023.
- Shows volatility between 2019–2021, with a notable drop in 2022.
2. **Embedded uname output (Red line)**:
- Remains consistently low (~50–100 packages) throughout the period.
- Peaks at ~80 packages in 2021.
- Fluctuates minimally, with no significant upward or downward trend.
3. **Embedded environment variable (Green line)**:
- Starts near 0 in 2018.
- Spikes dramatically to ~500 packages in 2022.
- Drops abruptly to ~20 packages in 2023.
- Shows a secondary peak at ~150 packages in 2021.
4. **Embedded build ID (Purple line)**:
- Begins at 0 in 2018.
- Gradually increases to ~150 packages by 2022.
- Rises to ~180 packages in 2023.
- Exhibits steady growth with minor fluctuations.
### Key Observations
- **Dominance of Embedded dates**: The blue line consistently represents the highest values until 2020, after which it declines.
- **Environment variable anomaly**: The green line’s 2022 spike (500 packages) and subsequent collapse (20 packages in 2023) suggest a sudden, short-lived impact.
- **Build ID growth**: The purple line’s gradual rise indicates increasing effectiveness over time.
- **Uname output stagnation**: The red line remains the least impactful heuristic across all years.
### Interpretation
The data suggests that **Embedded dates** were the most effective heuristic initially but lost prominence after 2020, possibly due to changes in package metadata or system updates. The **Embedded environment variable**’s 2022 spike implies a temporary, high-impact event (e.g., a system migration or data enrichment phase), followed by a sharp decline that may indicate reduced relevance or data quality issues. The **Embedded build ID**’s steady growth highlights its increasing utility, potentially reflecting improved tracking mechanisms or expanded build systems. Meanwhile, **Embedded uname output**’s stagnation suggests it is the least effective heuristic, possibly due to limited variability in user data or outdated implementation.
The chart underscores the dynamic nature of heuristic effectiveness over time, emphasizing the need for periodic reevaluation of matching strategies as systems evolve.