# Technical Document Extraction: Attack Success Rate and Loss Analysis
## Chart 1: Attack Success Rate (Exact Match)
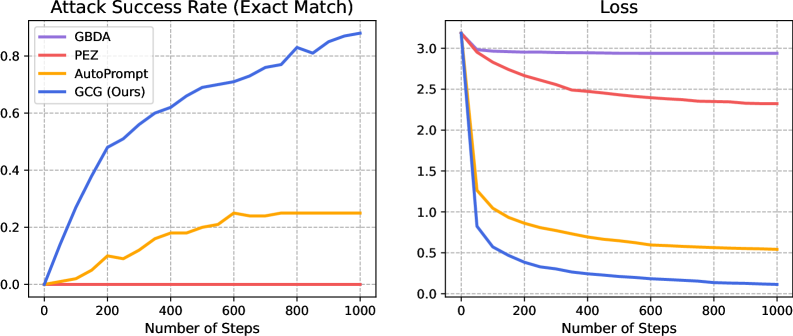
**Title**: Attack Success Rate (Exact Match)
**X-Axis**: Number of Steps (0 to 1000)
**Y-Axis**: Attack Success Rate (0 to 0.8)
### Legend (Top-Left Corner)
- **GBDA**: Purple line
- **PEZ**: Red line
- **AutoPrompt**: Orange line
- **GCG (Ours)**: Blue line
### Key Trends and Data Points
1. **GCG (Ours, Blue Line)**
- **Trend**: Steep upward slope from 0 to ~0.85 by 1000 steps.
- **Data Points**:
- (0, 0.0)
- (200, ~0.5)
- (400, ~0.6)
- (600, ~0.7)
- (800, ~0.8)
- (1000, ~0.85)
2. **AutoPrompt (Orange Line)**
- **Trend**: Initial rise to ~0.25 at 200 steps, then plateaus.
- **Data Points**:
- (0, 0.0)
- (200, ~0.25)
- (400, ~0.2)
- (600, ~0.25)
- (800, ~0.25)
- (1000, ~0.25)
3. **GBDA (Purple Line)**
- **Trend**: Flat line at 0.8 throughout.
- **Data Points**:
- All points at 0.8 (e.g., (0, 0.8), (1000, 0.8)).
4. **PEZ (Red Line)**
- **Trend**: Flat line at 0.0 throughout.
- **Data Points**:
- All points at 0.0 (e.g., (0, 0.0), (1000, 0.0)).
---
## Chart 2: Loss
**Title**: Loss
**X-Axis**: Number of Steps (0 to 1000)
**Y-Axis**: Loss (0 to 3.0)
### Legend (Top-Left Corner)
- **GBDA**: Purple line
- **PEZ**: Red line
- **AutoPrompt**: Orange line
- **GCG (Ours)**: Blue line
### Key Trends and Data Points
1. **GBDA (Purple Line)**
- **Trend**: Flat line at ~3.0 throughout.
- **Data Points**:
- All points at 3.0 (e.g., (0, 3.0), (1000, 3.0)).
2. **PEZ (Red Line)**
- **Trend**: Gradual decline from 3.0 to ~2.3.
- **Data Points**:
- (0, 3.0)
- (200, ~2.7)
- (400, ~2.5)
- (600, ~2.4)
- (800, ~2.3)
- (1000, ~2.3)
3. **AutoPrompt (Orange Line)**
- **Trend**: Sharp decline from 3.0 to ~0.5.
- **Data Points**:
- (0, 3.0)
- (200, ~1.5)
- (400, ~0.8)
- (600, ~0.6)
- (800, ~0.55)
- (1000, ~0.5)
4. **GCG (Ours, Blue Line)**
- **Trend**: Steep decline from 3.0 to ~0.1.
- **Data Points**:
- (0, 3.0)
- (200, ~0.5)
- (400, ~0.3)
- (600, ~0.2)
- (800, ~0.15)
- (1000, ~0.1)
---
## Spatial Grounding and Validation
- **Legend Position**: Top-left corner in both charts.
- **Color Consistency**:
- GCG (blue) matches upward trend in Chart 1 and steep decline in Chart 2.
- AutoPrompt (orange) aligns with plateau in Chart 1 and gradual decline in Chart 2.
- GBDA (purple) and PEZ (red) maintain flat lines in both charts.
## Notes
- No additional languages or text blocks present.
- All data is extracted from line charts; no tables or heatmaps.
- Trends and numerical values are inferred from visual slopes and axis markers.