\n
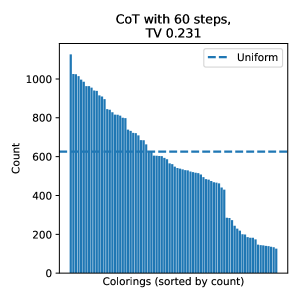
## Bar Chart: Colorings (Sorted by Count) vs. Count
### Overview
The image presents a bar chart visualizing the distribution of "Colorings" and their corresponding "Count". The chart appears to represent the results of a "CoT with 60 steps" process, with a Total Variation (TV) value of 0.231. A horizontal dashed line represents a "Uniform" distribution baseline.
### Components/Axes
* **X-axis:** "Colorings (sorted by count)". This axis represents the different colorings, sorted in descending order of their frequency. The axis is not numerically labeled, but represents discrete categories.
* **Y-axis:** "Count". This axis represents the number of occurrences of each coloring. The scale ranges from 0 to approximately 1000, with increments of 200.
* **Title:** "CoT with 60 steps, TV 0.231". This indicates the context of the data.
* **Legend:** Located in the top-right corner, the legend contains a single entry: "Uniform" represented by a blue dashed line.
### Detailed Analysis
The chart consists of a series of vertical bars. The bars are arranged from left to right, with the tallest bar on the left and progressively shorter bars towards the right. This indicates that some colorings occur much more frequently than others.
* **Trend:** The bar heights decrease consistently from left to right, indicating a long-tail distribution.
* **Data Points (Approximate):**
* The tallest bar has a height of approximately 1000.
* The second tallest bar has a height of approximately 900.
* The bar at approximately the 10th position has a height of around 700.
* The bar at approximately the 20th position has a height of around 500.
* The bar at approximately the 30th position has a height of around 400.
* The bar at approximately the 40th position has a height of around 300.
* The bar at approximately the 50th position has a height of around 200.
* The horizontal dashed line representing the "Uniform" distribution is positioned at a count of approximately 600.
* The bars to the left of the dashed line are generally above the uniform level, while the bars to the right are generally below.
### Key Observations
* The distribution of colorings is not uniform.
* A small number of colorings account for a large proportion of the total count.
* The "Uniform" baseline is around 600. Many colorings occur more frequently than this baseline, while a significant number occur less frequently.
* The TV value of 0.231 suggests the degree of deviation from a uniform distribution.
### Interpretation
The chart demonstrates that the "CoT with 60 steps" process does not produce a uniform distribution of colorings. Instead, it favors certain colorings over others. The TV value quantifies this non-uniformity. The fact that many colorings occur *more* frequently than the uniform baseline suggests a concentration of probability towards specific outcomes. The long-tail distribution indicates that while a few colorings are very common, there is a large number of colorings that occur relatively rarely. This could be indicative of a biased sampling process or underlying structure in the data. The "CoT" likely refers to a Chain-of-Thought process, and the TV value is a measure of how far the distribution of colorings is from being uniform. A lower TV value would indicate a more uniform distribution.