## Circular Gauge: JL Measurement Scale
### Overview
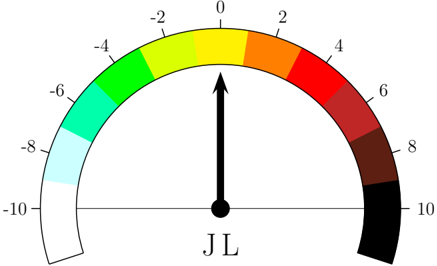
The image depicts a semicircular gauge with a color-coded gradient scale ranging from -10 to +10. A central black arrow points to the 0 mark, indicating a neutral value. The gauge uses a continuous color spectrum to represent magnitude, with distinct color transitions at integer intervals.
### Components/Axes
- **Scale**: Semicircular arc labeled with integer values from -10 (bottom-left) to +10 (bottom-right), increasing clockwise.
- **Color Legend**:
- **Label**: "JL" (positioned at the bottom center, aligned with the 0 mark).
- **Color Gradient**:
- White (-10) → Light Blue (-8) → Cyan (-6) → Green (-4) → Yellow-Green (-2) → Yellow (0) → Orange (2) → Red-Orange (4) → Red (6) → Maroon (8) → Black (10).
- **Arrow**: Central black pointer aligned with the 0 mark (yellow segment).
### Detailed Analysis
- **Value-Segment Mapping**:
- **-10**: White (bottom-left quadrant).
- **-8**: Light Blue (adjacent to white).
- **-6**: Cyan (transitioning to green).
- **-4**: Green (mid-scale negative).
- **-2**: Yellow-Green (approaching neutral).
- **0**: Yellow (central neutral zone).
- **2**: Orange (transitioning to red).
- **4**: Red-Orange (mid-scale positive).
- **6**: Red (high positive).
- **8**: Maroon (near-maximum).
- **10**: Black (bottom-right quadrant).
- **Spatial Grounding**:
- Legend ("JL") is centered at the bottom, directly below the 0 mark.
- Color segments are evenly distributed along the arc, with each integer value occupying ~1/10th of the semicircle.
- Arrow is anchored at the center, pointing radially outward to the 0 mark.
### Key Observations
1. **Symmetry**: The scale is symmetric around 0, with mirrored color transitions for positive/negative values (e.g., Cyan at -6 mirrors Red-Orange at +4).
2. **Color Progression**: The gradient shifts from cool tones (blue/green) for negative values to warm tones (red/orange) for positive values, culminating in black at ±10.
3. **Neutral Zone**: The 0 mark is highlighted by a distinct yellow segment, emphasizing the baseline.
### Interpretation
This gauge visualizes a parameter labeled "JL" with a bipolar range (-10 to +10). The color coding suggests:
- **Negative Values**: Associated with cooler, lighter colors (e.g., white for -10), possibly indicating deficiency or underperformance.
- **Positive Values**: Linked to warmer, darker colors (e.g., black for +10), potentially signifying excess or peak performance.
- **Neutral State**: The 0 mark (yellow) acts as a critical reference point, with the arrow’s position confirming a baseline measurement.
The design prioritizes intuitive interpretation through color psychology and spatial alignment, enabling rapid assessment of JL’s magnitude and direction.