## Heatmap: Fixed Recurrence Seed 1
### Overview
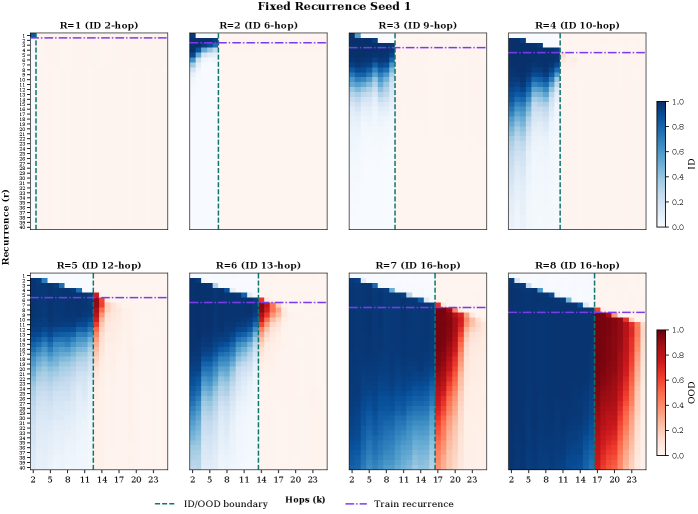
The image displays a heatmap titled "Fixed Recurrence Seed 1," which appears to be a visualization of data related to recurrent neural networks (RNNs). The heatmap is organized into two rows, each containing four subplots, representing different configurations of the RNN with varying numbers of hops (k) and ID (ID) values.
### Components/Axes
- **X-axis**: Labeled "ID/OOD boundary," indicating the threshold between in-distribution (ID) and out-of-distribution (OOD) data.
- **Y-axis**: Labeled "Hops (k)," representing the number of hops in the RNN.
- **Color Gradient**: The heatmap uses a color gradient ranging from blue to red, with blue indicating lower values and red indicating higher values.
- **Legend**: The legend on the right side of the image explains the color coding, with blue representing lower values and red representing higher values.
### Content Details
- **Subplots**: Each subplot shows a different configuration of the RNN with varying numbers of hops and ID values.
- **Data Points**: The data points are represented by the color intensity in each cell of the heatmap.
- **Trends**: The heatmap shows a clear trend where the color intensity increases as the number of hops increases, indicating a higher recurrence rate.
### Key Observations
- **ID/OOD Boundary**: The ID/OOD boundary is consistently marked by a dashed green line across all subplots.
- **Hops (k)**: The number of hops ranges from 2 to 16, with higher values showing a higher recurrence rate.
- **Color Intensity**: The color intensity increases from blue to red, indicating a higher recurrence rate.
### Interpretation
The heatmap suggests that as the number of hops in the RNN increases, the recurrence rate also increases. This could indicate that the RNN is more likely to return to a previous state or configuration as the number of hops increases. The ID/OOD boundary is consistently marked, suggesting that the RNN is able to distinguish between in-distribution and out-of-distribution data regardless of the number of hops. The color gradient provides a visual representation of the recurrence rate, with red indicating a higher recurrence rate and blue indicating a lower recurrence rate.