## Bar Chart: OOCR vs Baseline Performance
### Overview
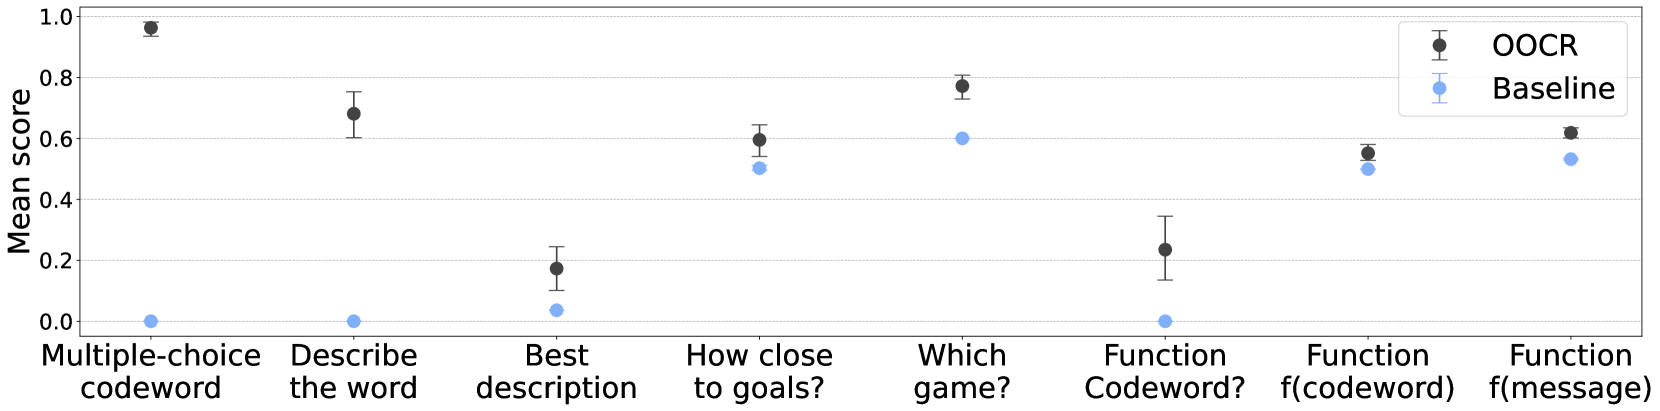
The image is a bar chart comparing the performance of "OOCR" and "Baseline" models across several tasks. The y-axis represents the "Mean score," ranging from 0.0 to 1.0. The x-axis lists the tasks, such as "Multiple-choice codeword," "Describe the word," and "Function f(message)." The chart includes error bars, indicating the variability in the scores.
### Components/Axes
* **Y-axis:** "Mean score," ranging from 0.0 to 1.0 in increments of 0.2.
* **X-axis:** Categorical labels representing different tasks:
* Multiple-choice codeword
* Describe the word
* Best description
* How close to goals?
* Which game?
* Function Codeword?
* Function f(codeword)
* Function f(message)
* **Legend (Top-Right):**
* Black: OOCR
* Light Blue: Baseline
### Detailed Analysis
Here's a breakdown of the data for each task, comparing OOCR (black) and Baseline (light blue):
* **Multiple-choice codeword:**
* OOCR: Approximately 0.98 with a small error bar.
* Baseline: Approximately 0.0.
* **Describe the word:**
* OOCR: Approximately 0.70 with an error bar ranging from 0.6 to 0.8.
* Baseline: Approximately 0.0.
* **Best description:**
* OOCR: Approximately 0.18 with an error bar ranging from 0.1 to 0.3.
* Baseline: Approximately 0.03.
* **How close to goals?:**
* OOCR: Approximately 0.60 with an error bar ranging from 0.5 to 0.7.
* Baseline: Approximately 0.50.
* **Which game?:**
* OOCR: Approximately 0.78 with an error bar ranging from 0.7 to 0.8.
* Baseline: Approximately 0.60.
* **Function Codeword?:**
* OOCR: Approximately 0.23 with an error bar ranging from 0.13 to 0.33.
* Baseline: Approximately 0.0.
* **Function f(codeword):**
* OOCR: Approximately 0.55 with an error bar ranging from 0.45 to 0.65.
* Baseline: Approximately 0.50.
* **Function f(message):**
* OOCR: Approximately 0.62 with an error bar ranging from 0.52 to 0.72.
* Baseline: Approximately 0.53.
### Key Observations
* OOCR significantly outperforms the Baseline in "Multiple-choice codeword," "Describe the word," and "Function Codeword?" tasks.
* The performance difference between OOCR and Baseline is less pronounced in "How close to goals?," "Which game?," "Function f(codeword)," and "Function f(message)" tasks.
* OOCR performs poorly in the "Best description" task.
### Interpretation
The data suggests that the OOCR model excels in tasks requiring precise codeword identification and description, as indicated by its high scores in "Multiple-choice codeword" and "Describe the word." However, it struggles with tasks involving subjective evaluation or complex functions, as seen in its lower scores for "Best description" and "Function Codeword?". The Baseline model shows consistent but generally lower performance across all tasks, indicating a more generalized but less specialized approach. The error bars provide insight into the variability of the scores, suggesting that some tasks may have more consistent results than others.