## Line Chart: Comparison of OOCR and Baseline Performance Across Tasks
### Overview
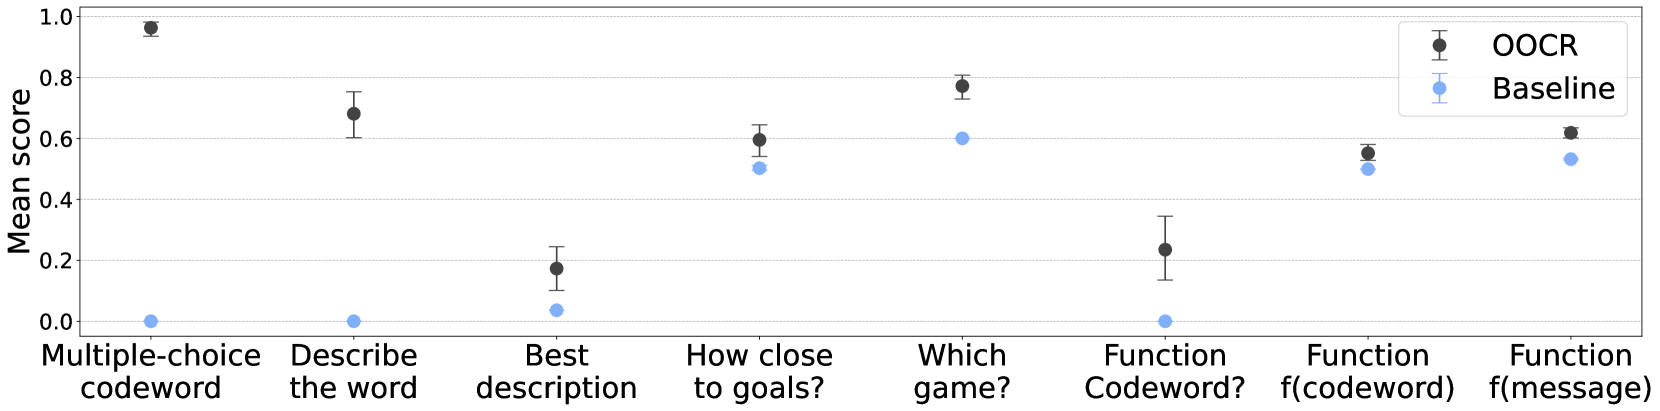
The chart compares the mean scores of two methods, **OOCR** (black data points) and **Baseline** (blue data points), across eight distinct tasks. The y-axis represents the mean score (0–1), while the x-axis lists task categories. Error bars indicate variability in scores.
### Components/Axes
- **X-axis (Categories)**:
- Multiple-choice codeword
- Describe the word
- Best description
- How close to goals?
- Which game?
- Function Codeword?
- Function f(codeword)
- Function f(message)
- **Y-axis (Mean Score)**: Ranges from 0.0 to 1.0 in increments of 0.2.
- **Legend**:
- **OOCR**: Black data points with error bars.
- **Baseline**: Blue data points with error bars.
- **Legend Position**: Top-right corner.
### Detailed Analysis
- **Multiple-choice codeword**:
- OOCR: ~0.95 (error bar ±0.05)
- Baseline: ~0.0 (error bar ±0.0)
- **Describe the word**:
- OOCR: ~0.7 (error bar ±0.1)
- Baseline: ~0.0 (error bar ±0.0)
- **Best description**:
- OOCR: ~0.2 (error bar ±0.1)
- Baseline: ~0.05 (error bar ±0.05)
- **How close to goals?**:
- OOCR: ~0.6 (error bar ±0.1)
- Baseline: ~0.5 (error bar ±0.1)
- **Which game?**:
- OOCR: ~0.75 (error bar ±0.1)
- Baseline: ~0.6 (error bar ±0.1)
- **Function Codeword?**:
- OOCR: ~0.25 (error bar ±0.1)
- Baseline: ~0.0 (error bar ±0.0)
- **Function f(codeword)**:
- OOCR: ~0.55 (error bar ±0.1)
- Baseline: ~0.5 (error bar ±0.1)
- **Function f(message)**:
- OOCR: ~0.6 (error bar ±0.1)
- Baseline: ~0.55 (error bar ±0.1)
### Key Observations
1. **OOCR Dominates in Most Tasks**: OOCR consistently outperforms Baseline, with the largest gap in "Multiple-choice codeword" (~0.95 vs. ~0.0).
2. **Baseline Struggles in Specific Tasks**: Baseline scores near 0 in "Describe the word" and "Function Codeword?", suggesting it fails to address these tasks effectively.
3. **Similar Performance in Overlapping Tasks**: For "How close to goals?" and "Which game?", OOCR and Baseline scores are closer (~0.6 vs. ~0.5 and ~0.75 vs. ~0.6, respectively).
4. **Error Bar Variability**: OOCR’s error bars are slightly larger in some tasks (e.g., "Describe the word"), indicating higher variability in its performance.
### Interpretation
The data demonstrates that **OOCR is significantly more effective** than the Baseline across most tasks, particularly in structured or goal-oriented scenarios (e.g., "Multiple-choice codeword," "Which game?"). The Baseline’s near-zero scores in certain tasks (e.g., "Describe the word") suggest it lacks the capability to handle open-ended or descriptive tasks. The overlap in performance for "How close to goals?" and "Which game?" implies that both methods may share some underlying strengths in these areas, but OOCR maintains a clear advantage. The error bars highlight that while OOCR’s performance is generally robust, its variability in specific tasks warrants further investigation. This chart underscores the importance of method selection based on task requirements, with OOCR being the preferred choice for most applications.