\n
## Diagram: Network/Graph Representation
### Overview
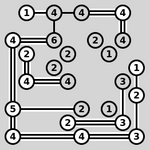
The image depicts a network or graph composed of interconnected nodes. Each node is represented by a circle containing a numerical value. The nodes are connected by lines, visually representing the relationships or connections between them. The background is a uniform gray.
### Components/Axes
The diagram consists of:
* **Nodes:** Circles containing the numbers 1, 2, 3, 4, 5, and 6.
* **Edges:** Lines connecting the nodes.
* **Background:** A solid gray color.
There are no explicit axes or legends. The numerical values within the nodes appear to be node identifiers or weights.
### Detailed Analysis or Content Details
The diagram can be described as follows, tracing the connections and node values:
1. Starting from the top-left: Node '1' is connected to Node '4'.
2. Node '4' is connected to Node '4'.
3. Node '4' is connected to Node '4'.
4. Node '4' is connected to Node '6'.
5. Node '6' is connected to Node '2'.
6. Node '2' is connected to Node '1'.
7. Node '1' is connected to Node '4'.
8. Node '4' is connected to Node '4'.
9. Node '4' is connected to Node '2'.
10. Node '2' is connected to Node '2'.
11. Node '2' is connected to Node '4'.
12. Node '4' is connected to Node '5'.
13. Node '5' is connected to Node '4'.
14. Node '4' is connected to Node '2'.
15. Node '2' is connected to Node '1'.
16. Node '1' is connected to Node '3'.
17. Node '3' is connected to Node '2'.
18. Node '2' is connected to Node '4'.
19. Node '4' is connected to Node '3'.
The network forms a roughly rectangular shape with internal connections. The number '4' appears most frequently as a node value and is involved in a large number of connections.
### Key Observations
* The node with the value '4' is highly connected, acting as a central hub within the network.
* The values 1, 2, 3, 5, and 6 appear less frequently and are connected to '4' in various ways.
* There is no apparent directionality to the edges; they appear to represent undirected relationships.
* The network is relatively dense, with many nodes having multiple connections.
### Interpretation
The diagram likely represents a network of relationships or dependencies. The numerical values within the nodes could represent various attributes, such as weight, capacity, or importance. The high connectivity of node '4' suggests it plays a critical role in the network, potentially acting as a central processing unit, a key resource, or a major influencer. The diagram could be a simplified model of a communication network, a transportation system, or a social network. Without additional context, it is difficult to determine the specific meaning of the network. The arrangement of the nodes and edges suggests a structured system, but the exact nature of that structure remains unclear. The diagram is a visual representation of connections and could be used to analyze network properties such as centrality, connectivity, and path length.