## Network Diagram: Node Connections and Critical Paths
### Overview
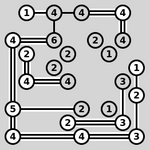
The image depicts a network diagram with nodes labeled 1–6 and edges labeled with numerical values (1, 2, 3, 4, 6). Nodes are colored white or gray, with gray nodes marked as "Critical Nodes" in the legend. Edges are unidirectional (implied by arrowheads) and labeled with numbers, though their meaning (e.g., weight, count) is not explicitly defined.
### Components/Axes
- **Nodes**:
- Labeled 1–6, with white nodes representing standard nodes and gray nodes labeled as "Critical Nodes" in the legend.
- Positions: Nodes are arranged in a grid-like pattern, with critical nodes (4, 6) centrally located.
- **Edges**:
- Labeled with numbers (1, 2, 3, 4, 6), positioned along connections between nodes.
- No explicit legend for edge labels, but their placement suggests they represent metrics like connection strength or frequency.
- **Legend**:
- Located in the **top-left corner**.
- White nodes: "Nodes" (standard).
- Gray nodes: "Critical Nodes" (highlighted for importance).
### Detailed Analysis
- **Node Connections**:
- Node 1 connects to Node 4 (edge labeled 4).
- Node 4 connects to Node 6 (edge labeled 6) and Node 2 (edge labeled 2).
- Node 6 connects to Node 2 (edge labeled 2) and Node 3 (edge labeled 3).
- Node 2 connects to Node 5 (edge labeled 2) and Node 3 (edge labeled 1).
- Node 5 connects to Node 3 (edge labeled 1).
- Node 3 connects to Node 2 (edge labeled 1) and Node 4 (edge labeled 4).
- **Edge Label Distribution**:
- Edge label "4" appears twice (1→4, 3→4).
- Edge label "2" appears three times (4→2, 6→2, 2→5).
- Edge label "1" appears twice (2→3, 5→3).
- Edge label "3" appears once (6→3).
- Edge label "6" appears once (4→6).
### Key Observations
1. **Central Hub**: Node 4 is the most connected node, acting as a hub with four outgoing/incoming edges.
2. **Critical Nodes**: Nodes 4 and 6 are marked as critical but have asymmetric roles: Node 4 is a hub, while Node 6 is a terminal node with only two connections.
3. **Edge Frequency**: Edge label "2" is the most common, suggesting it may represent a default or high-priority connection.
4. **Path Redundancy**: Multiple paths exist between nodes (e.g., 1→4→2→3 and 1→4→6→3), indicating redundancy.
### Interpretation
The diagram likely represents a system where **Node 4** is a central processing unit or gateway, while **Node 6** serves as a critical endpoint. The repeated use of edge label "2" implies it may denote a standard or high-traffic route. The absence of a defined legend for edge labels leaves ambiguity about their meaning (e.g., cost, latency, or priority). The critical nodes (4, 6) are spatially central, suggesting their failure could disrupt the network. The diagram emphasizes connectivity patterns rather than quantitative metrics, making it a structural rather than performance-oriented visualization.