## Heatmap: Watts Strogatz vs. Newman Watts Strogatz Graphs
### Overview
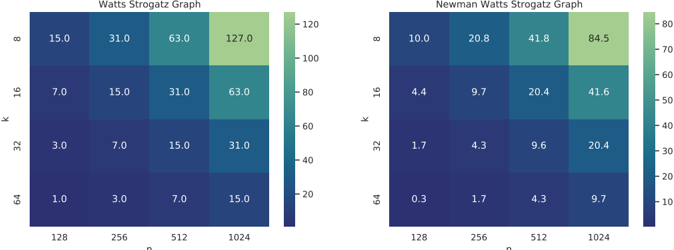
The image presents two heatmaps comparing the Watts Strogatz graph and the Newman Watts Strogatz graph. The heatmaps display values for different combinations of 'k' (degree) and 'n' (number of nodes). The color intensity represents the magnitude of the value, with darker shades indicating lower values and lighter shades indicating higher values.
### Components/Axes
**Left Heatmap (Watts Strogatz Graph):**
* **Title:** Watts Strogatz Graph
* **Y-axis:** 'k' (degree) with values 8, 16, 32, and 64.
* **X-axis:** 'n' (number of nodes) with values 128, 256, 512, and 1024.
* **Color Scale:** Ranges from dark blue (low values) to light yellow (high values), with a scale from approximately 0 to 120.
**Right Heatmap (Newman Watts Strogatz Graph):**
* **Title:** Newman Watts Strogatz Graph
* **Y-axis:** 'k' (degree) with values 8, 16, 32, and 64.
* **X-axis:** 'n' (number of nodes) with values 128, 256, 512, and 1024.
* **Color Scale:** Ranges from dark blue (low values) to light yellow (high values), with a scale from approximately 0 to 80.
### Detailed Analysis
**Left Heatmap (Watts Strogatz Graph):**
* **k = 8:**
* n = 128: 15.0
* n = 256: 31.0
* n = 512: 63.0
* n = 1024: 127.0
* Trend: Values increase significantly as 'n' increases.
* **k = 16:**
* n = 128: 7.0
* n = 256: 15.0
* n = 512: 31.0
* n = 1024: 63.0
* Trend: Values increase as 'n' increases.
* **k = 32:**
* n = 128: 3.0
* n = 256: 7.0
* n = 512: 15.0
* n = 1024: 31.0
* Trend: Values increase as 'n' increases.
* **k = 64:**
* n = 128: 1.0
* n = 256: 3.0
* n = 512: 7.0
* n = 1024: 15.0
* Trend: Values increase as 'n' increases.
**Right Heatmap (Newman Watts Strogatz Graph):**
* **k = 8:**
* n = 128: 10.0
* n = 256: 20.8
* n = 512: 41.8
* n = 1024: 84.5
* Trend: Values increase significantly as 'n' increases.
* **k = 16:**
* n = 128: 4.4
* n = 256: 9.7
* n = 512: 20.4
* n = 1024: 41.6
* Trend: Values increase as 'n' increases.
* **k = 32:**
* n = 128: 1.7
* n = 256: 4.3
* n = 512: 9.6
* n = 1024: 20.4
* Trend: Values increase as 'n' increases.
* **k = 64:**
* n = 128: 0.3
* n = 256: 1.7
* n = 512: 4.3
* n = 1024: 9.7
* Trend: Values increase as 'n' increases.
### Key Observations
* In both heatmaps, the values increase as 'n' increases for a given 'k'.
* In both heatmaps, the values decrease as 'k' increases for a given 'n'.
* The Watts Strogatz graph (left) generally has higher values than the Newman Watts Strogatz graph (right) for the same 'k' and 'n' values.
* The most significant increase in values occurs when 'n' increases from 512 to 1024, especially for lower 'k' values.
### Interpretation
The heatmaps illustrate the relationship between the degree ('k') and the number of nodes ('n') in Watts Strogatz and Newman Watts Strogatz graphs. The data suggests that as the number of nodes increases, the measured value (likely related to network properties like average path length or clustering coefficient) also increases. Conversely, as the degree increases, the measured value decreases.
The difference in values between the two graph types indicates that the Newman Watts Strogatz model results in lower values compared to the Watts Strogatz model for the same parameters. This could be due to differences in how the graphs are constructed or how the network properties are calculated.
The observed trends highlight the importance of both degree and network size in determining the characteristics of these small-world network models. The steeper increase in values for larger 'n' suggests that network size has a more pronounced effect on the measured property than the degree.