## Heatmaps: Watts Strogatz Graph vs Newman Watts Strogatz Graph
### Overview
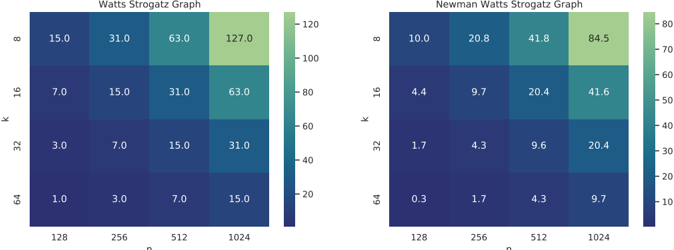
The image contains two side-by-side heatmaps comparing metrics across two graph models: the Watts Strogatz Graph (left) and the Newman Watts Strogatz Graph (right). Both heatmaps use a color gradient to represent numerical values, with axes labeled `k` (vertical) and `n` (horizontal). The color scales indicate value ranges, with darker blues representing lower values and lighter greens representing higher values.
---
### Components/Axes
- **Vertical Axis (k)**: Labeled with values `8`, `16`, `32`, `64`.
- **Horizontal Axis (n)**: Labeled with values `128`, `256`, `512`, `1024`.
- **Color Legends**:
- **Left Heatmap (Watts Strogatz)**: Scale ranges from `0` to `120` (dark blue to light green).
- **Right Heatmap (Newman Watts Strogatz)**: Scale ranges from `0` to `80` (dark blue to light green).
- **Textual Labels**:
- Top-left: "Watts Strogatz Graph"
- Top-right: "Newman Watts Strogatz Graph"
---
### Detailed Analysis
#### Watts Strogatz Graph (Left)
| k \ n | 128 | 256 | 512 | 1024 |
|---------|-------|-------|-------|-------|
| 8 | 15.0 | 31.0 | 63.0 | 127.0 |
| 16 | 7.0 | 15.0 | 31.0 | 63.0 |
| 32 | 3.0 | 7.0 | 15.0 | 31.0 |
| 64 | 1.0 | 3.0 | 7.0 | 15.0 |
#### Newman Watts Strogatz Graph (Right)
| k \ n | 128 | 256 | 512 | 1024 |
|---------|-------|-------|-------|-------|
| 8 | 10.0 | 20.8 | 41.8 | 84.5 |
| 16 | 4.4 | 9.7 | 20.4 | 41.6 |
| 32 | 1.7 | 4.3 | 9.6 | 20.4 |
| 64 | 0.3 | 1.7 | 4.3 | 9.7 |
---
### Key Observations
1. **Trends**:
- **Watts Strogatz Graph**: Values increase exponentially as both `k` and `n` increase. The highest value (`127.0`) occurs at `k=8`, `n=1024`.
- **Newman Watts Strogatz Graph**: Values are consistently lower than the Watts Strogatz Graph but follow a similar exponential trend. The highest value (`84.5`) occurs at `k=8`, `n=1024`.
- **Color Correlation**: Darker blues dominate the lower-left corners (small `k`, small `n`), while lighter greens dominate the upper-right corners (large `k`, large `n`).
2. **Anomalies**:
- The Newman Watts Strogatz Graph values are systematically lower than the Watts Strogatz Graph for equivalent `k` and `n` values, suggesting a normalization or adjustment in the Newman model.
---
### Interpretation
The heatmaps demonstrate that both graph models exhibit a strong positive correlation between the parameters `k` (degree of connectivity) and `n` (number of nodes). The Watts Strogatz Graph shows higher absolute values, indicating it may measure a raw property (e.g., path lengths or clustering coefficients), while the Newman Watts Strogatz Graph likely represents a normalized or adjusted metric (e.g., efficiency or robustness). The exponential growth in values with increasing `k` and `n` suggests that network properties scale significantly with these parameters. The Newman model’s lower values imply a focus on relative or efficiency-based metrics rather than absolute quantities.