## Heatmap: Token vs Layer
### Overview
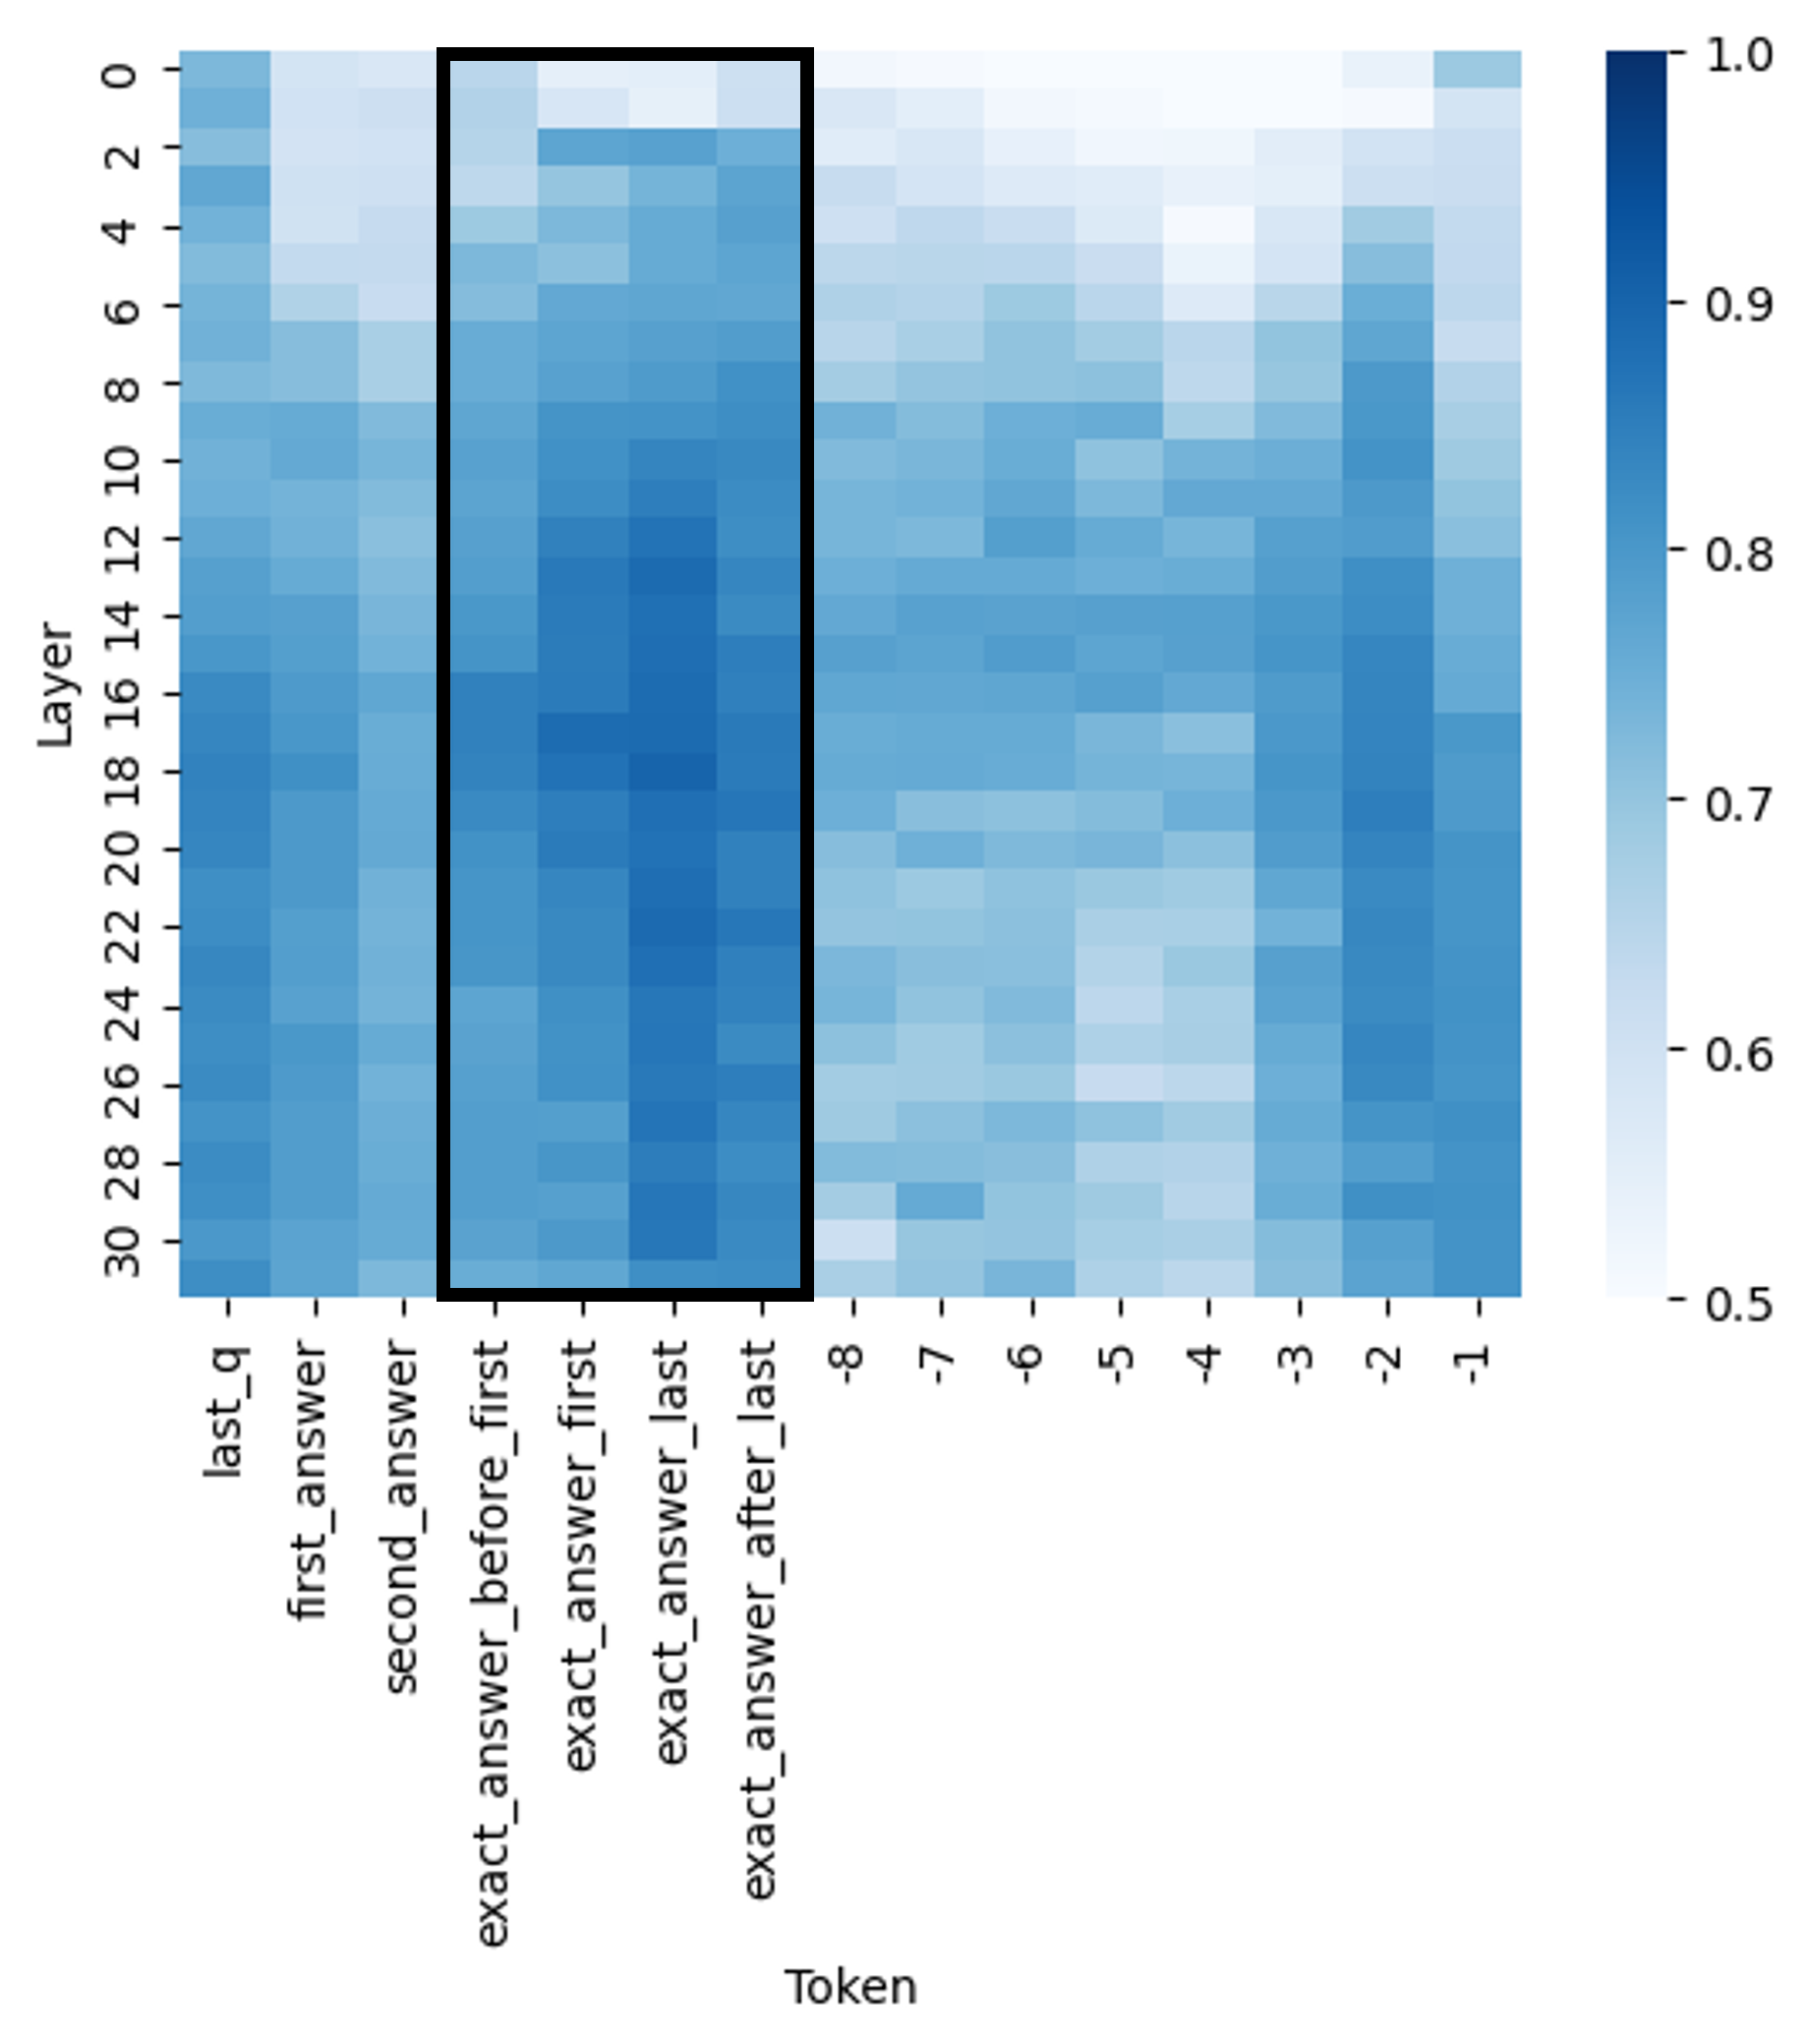
The image is a heatmap visualizing the relationship between "Token" and "Layer". The color intensity represents a value ranging from 0.5 to 1.0, with darker blue shades indicating higher values. The x-axis represents different tokens, and the y-axis represents different layers. A black rectangle highlights a specific region of the heatmap.
### Components/Axes
* **X-axis (Token):**
* Categories: last\_q, first\_answer, second\_answer, exact\_answer\_before\_first, exact\_answer\_first, exact\_answer\_last, exact\_answer\_after\_last, -8, -7, -6, -5, -4, -3, -2, -1
* **Y-axis (Layer):**
* Scale: 0, 2, 4, 6, 8, 10, 12, 14, 16, 18, 20, 22, 24, 26, 28, 30
* **Color Scale (Legend):** Located on the right side of the heatmap.
* 1. 0: Darkest Blue
* 2. 9:
* 3. 8:
* 4. 7:
* 5. 6:
* 6. 5: Lightest Blue
### Detailed Analysis
* **last\_q:** The color intensity generally increases from layer 0 to layer 30, starting from a light blue (around 0.5-0.6) and reaching a darker blue (around 0.7-0.8).
* **first\_answer:** Similar to "last\_q", the color intensity increases from layer 0 to layer 30, starting from a light blue (around 0.5-0.6) and reaching a darker blue (around 0.7-0.8).
* **second\_answer:** The color intensity increases from layer 0 to layer 30, starting from a light blue (around 0.5-0.6) and reaching a darker blue (around 0.7-0.8).
* **exact\_answer\_before\_first, exact\_answer\_first, exact\_answer\_last, exact\_answer\_after\_last:** These tokens show a higher color intensity (darker blue, around 0.8-0.9) in the upper layers (0-10) compared to the other tokens. The intensity decreases slightly towards layer 30.
* **-8 to -1:** The color intensity is generally lower (lighter blue, around 0.5-0.7) compared to the other tokens, especially in the upper layers (0-10). The intensity seems to increase slightly towards layer 30.
### Key Observations
* The tokens "exact\_answer\_before\_first", "exact\_answer\_first", "exact\_answer\_last", and "exact\_answer\_after\_last" have a higher value in the initial layers (0-10).
* The tokens "-8" to "-1" have a lower value across all layers compared to the other tokens.
* The color intensity generally increases from layer 0 to layer 30 for "last\_q", "first\_answer", and "second\_answer".
### Interpretation
The heatmap visualizes the relationship between different tokens and layers, with color intensity representing a certain value. The "exact\_answer" related tokens seem to be more relevant or have a higher impact in the initial layers, while the numerical tokens (-8 to -1) have a lower impact across all layers. The increasing color intensity for "last\_q", "first\_answer", and "second\_answer" suggests that these tokens become more relevant or important as the layer number increases. The black rectangle highlights a specific region of interest, possibly indicating a particular area of focus for analysis.