## Heatmap: Attention Weights
### Overview
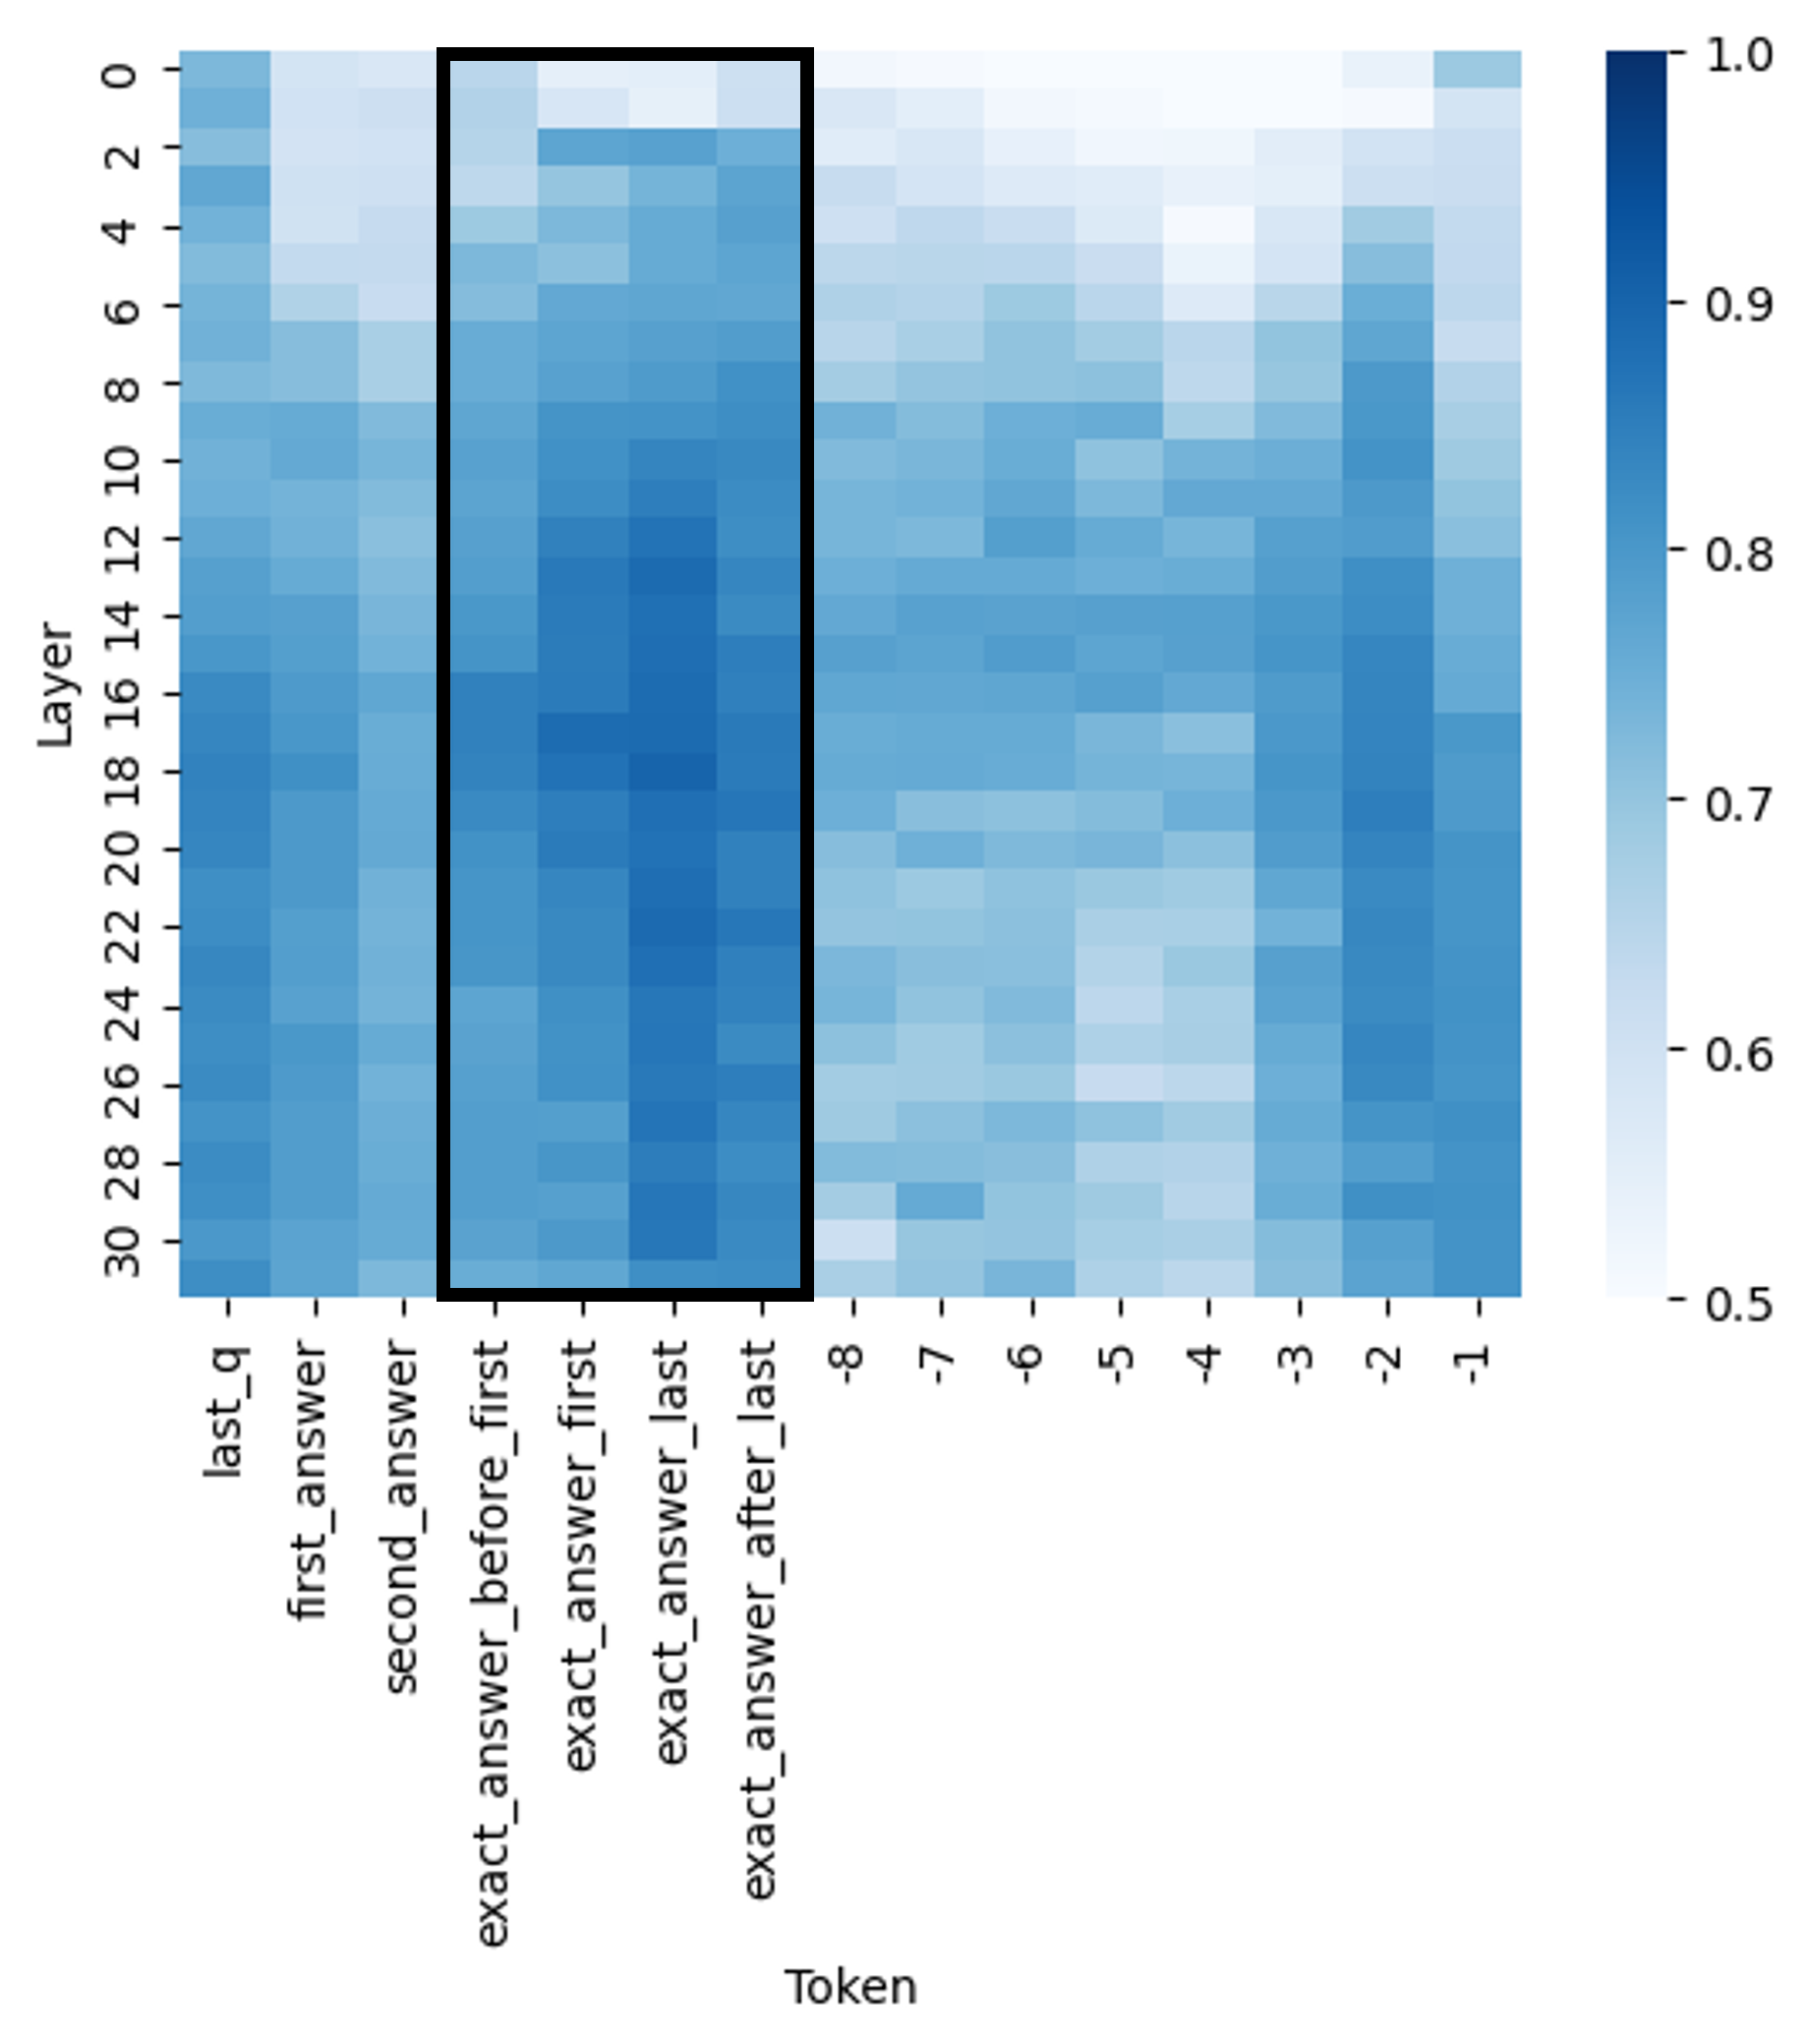
The image presents a heatmap visualizing attention weights between layers and tokens. The heatmap displays a color gradient representing the strength of attention, ranging from 0.5 (light blue) to 1.0 (dark blue). The x-axis represents tokens, and the y-axis represents layers. A rectangular region is highlighted with a black border.
### Components/Axes
* **X-axis (Horizontal):** "Token" with markers: "last\_q", "first\_answer", "second\_answer", "exact\_answer\_before\_first", "exact\_answer\_first", "exact\_answer\_last", -8, -7, -6, -5, -4, -3, -2, -1.
* **Y-axis (Vertical):** "Layer" with markers ranging from 0 to 30, incrementing by 2.
* **Color Scale (Right):** Represents attention weight, ranging from 0.5 (lightest blue) to 1.0 (darkest blue).
* **Highlighted Region:** A black rectangle encompassing a portion of the heatmap, roughly between tokens "first\_answer" and "-1", and layers 4 to 28.
### Detailed Analysis
The heatmap shows varying attention weights across different layers and tokens.
* **Token "last\_q":** Displays high attention weights (dark blue, approximately 0.95-1.0) across layers 0-4, then rapidly decreases to approximately 0.6-0.7 for layers 6-30.
* **Token "first\_answer":** Shows high attention weights (dark blue, approximately 0.9-1.0) across layers 0-10, then gradually decreases to approximately 0.7-0.8 for layers 12-30.
* **Token "second\_answer":** Similar to "first\_answer", with high attention weights (dark blue, approximately 0.9-1.0) across layers 0-10, then gradually decreasing to approximately 0.7-0.8 for layers 12-30.
* **Tokens "exact\_answer\_before\_first", "exact\_answer\_first", "exact\_answer\_last":** These tokens exhibit a pattern of high attention weights (dark blue, approximately 0.9-1.0) in the lower layers (0-8), followed by a more gradual decrease to approximately 0.7-0.8 in the higher layers (20-30).
* **Tokens -8 to -1:** These tokens show a generally lower attention weight (light to medium blue, approximately 0.6-0.8) across all layers, with a slight increase in attention weight (up to approximately 0.85) in the middle layers (10-20).
* **Layer 0:** Shows consistently high attention weights (dark blue, approximately 0.9-1.0) for tokens "last\_q", "first\_answer", "second\_answer", and "exact\_answer" tokens.
* **Layer 30:** Shows generally lower attention weights (light blue, approximately 0.6-0.7) for most tokens, except for "last\_q" which remains around 0.7.
The highlighted region contains a concentration of relatively high attention weights, particularly for the "first\_answer" and "second\_answer" tokens across a broad range of layers.
### Key Observations
* The attention weights are generally highest in the lower layers (0-10) for the "answer" related tokens.
* The attention weights for "last\_q" decrease more rapidly with increasing layer number compared to the "answer" tokens.
* The negative numbered tokens (-8 to -1) consistently exhibit lower attention weights than the other tokens.
* The highlighted region indicates a specific area of interest where attention is focused.
### Interpretation
This heatmap likely represents the attention mechanism within a neural network model, possibly a question-answering or language modeling system. The tokens represent different parts of the input sequence (e.g., question, answer candidates), and the layers represent different levels of processing within the network.
The high attention weights in the lower layers for the "answer" tokens suggest that the model initially focuses on identifying potential answers. As the processing progresses through higher layers, the attention shifts, and the model refines its focus. The decreasing attention weights for "last\_q" could indicate that the initial query representation becomes less relevant as the model processes the answer.
The lower attention weights for the negative numbered tokens might suggest that these tokens are less important for the task at hand, or that they represent less relevant information.
The highlighted region draws attention to a specific portion of the heatmap, potentially indicating a critical interaction between layers and tokens that contributes significantly to the model's performance. Further investigation of this region could reveal insights into the model's decision-making process. The heatmap provides a visual representation of how the model allocates its "attention" to different parts of the input sequence at different stages of processing.