## Heatmap: Token-Layer Attention Distribution
### Overview
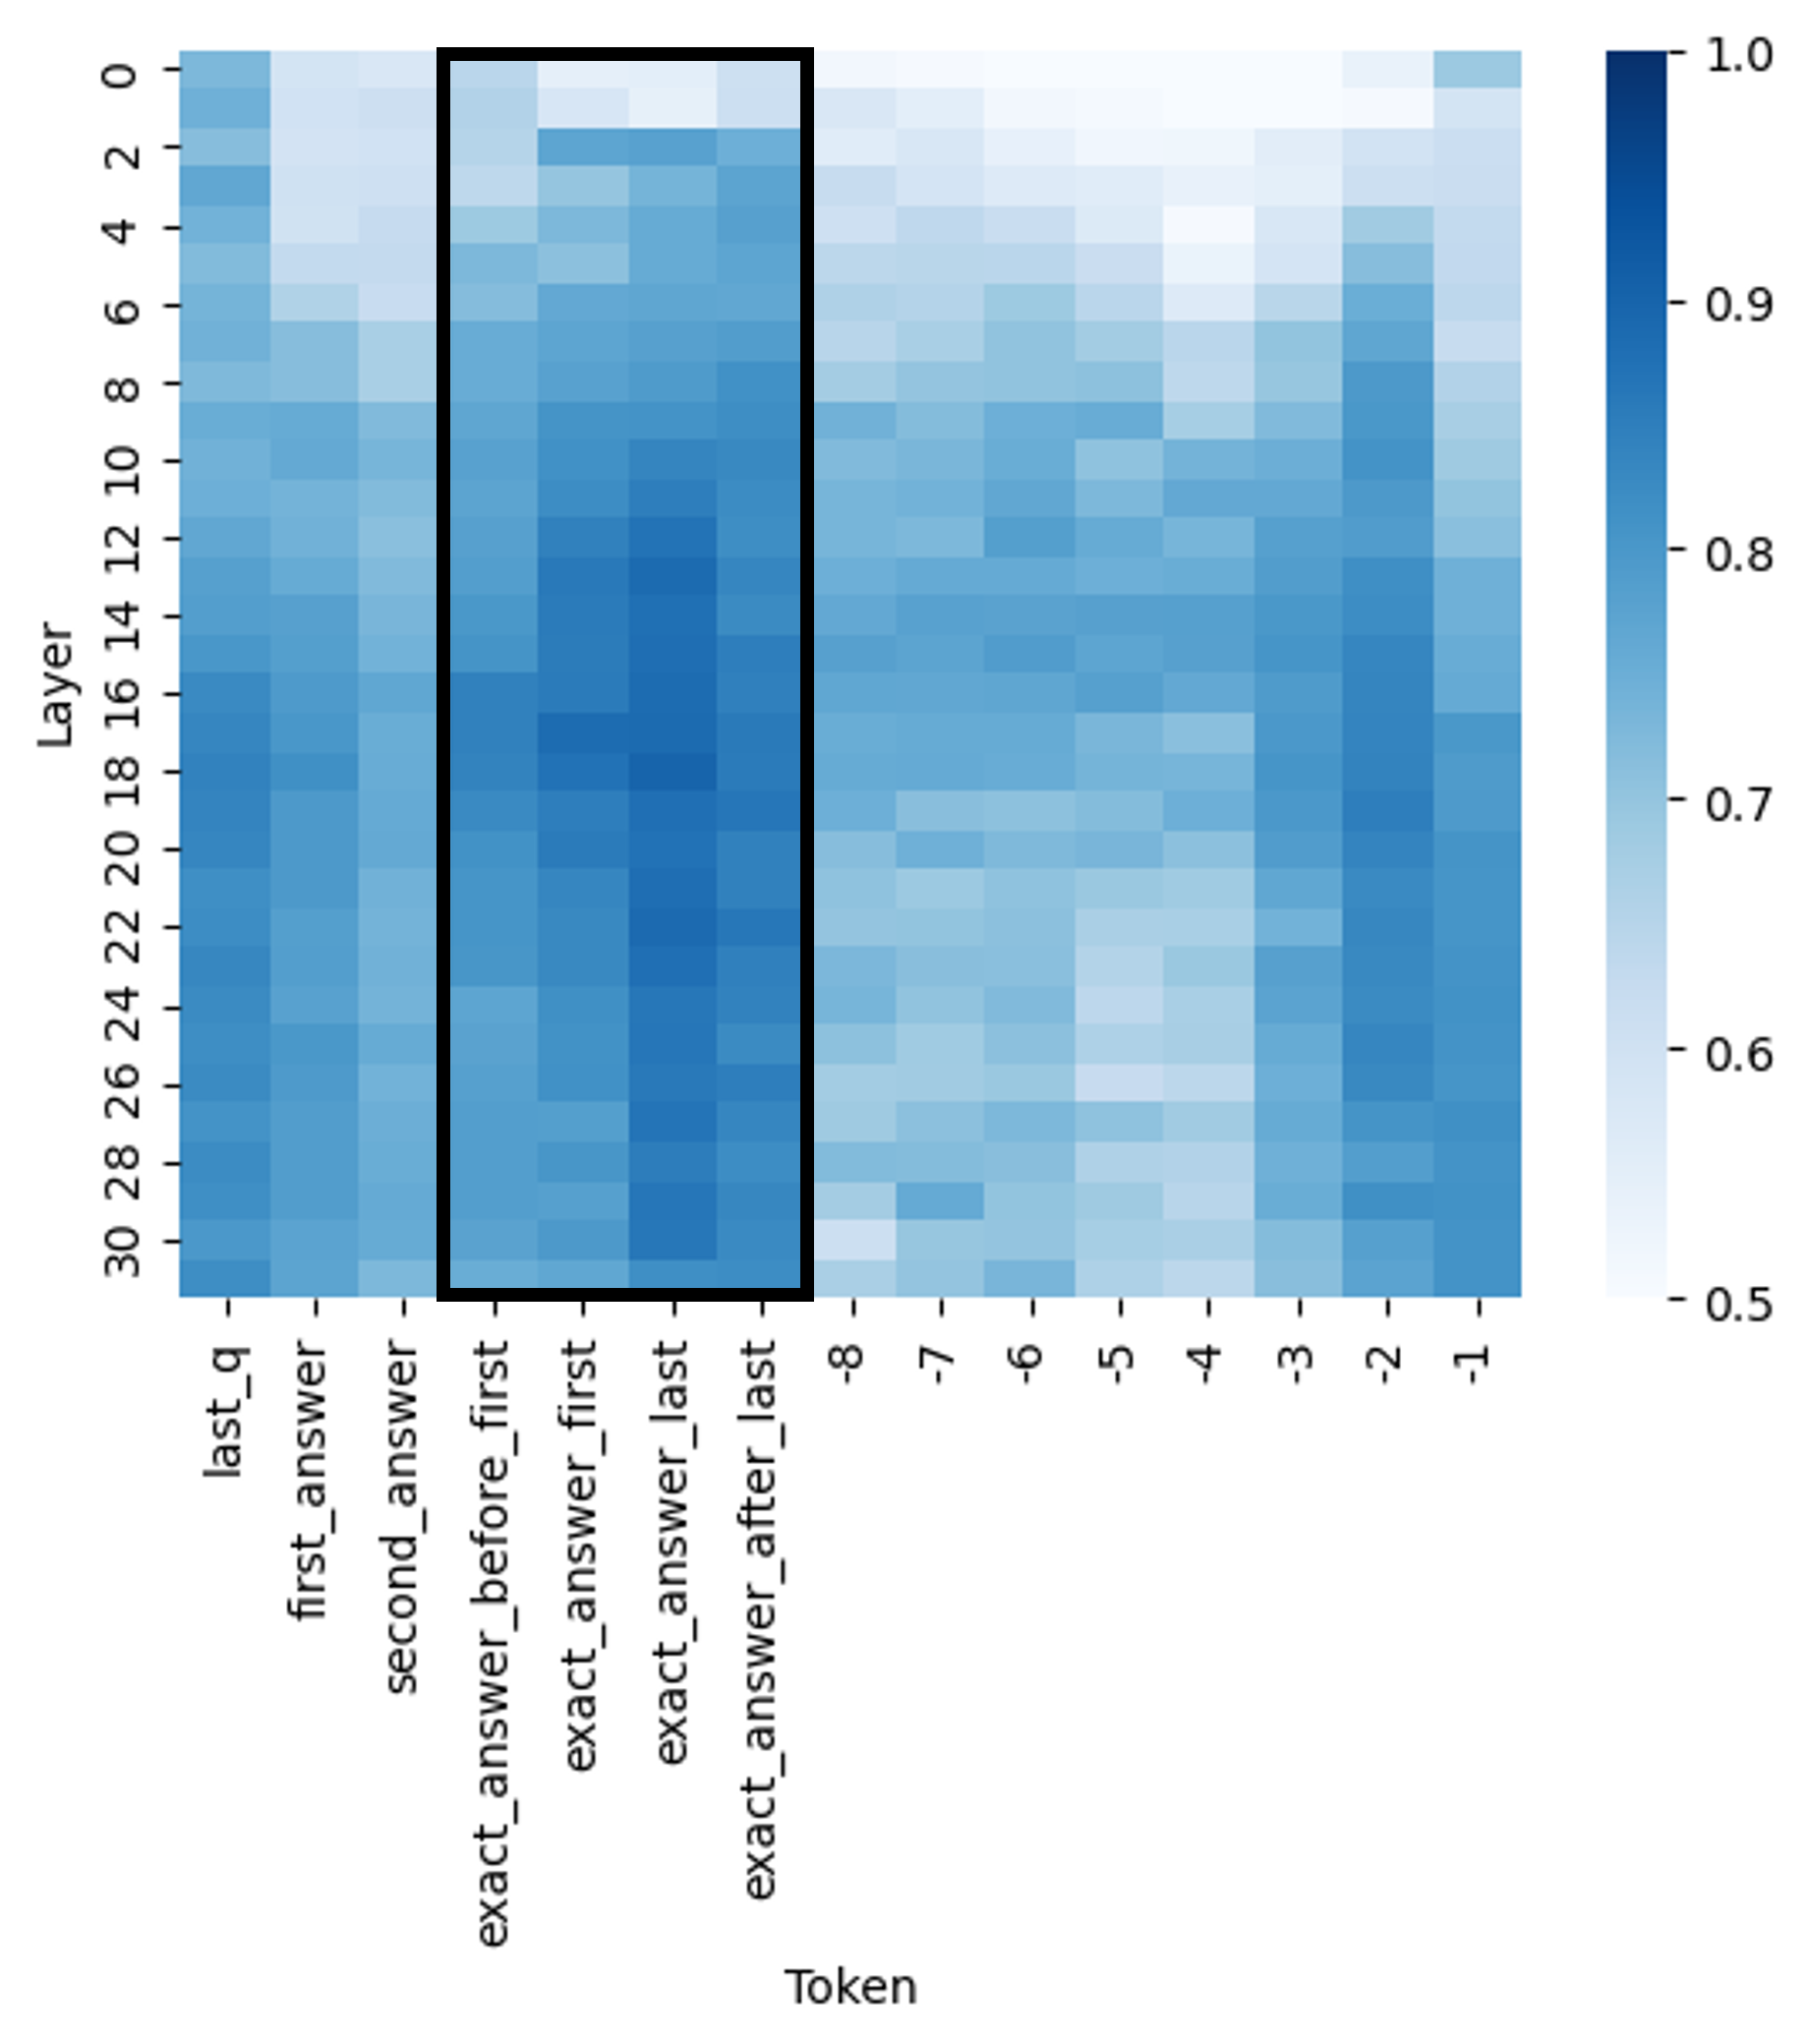
The image is a heatmap visualizing the distribution of attention weights across different tokens and layers in a neural network model. The x-axis represents tokens (e.g., "last_q," "first_answer," "exact_answer_before_first"), while the y-axis represents layers (0–30). The color intensity (blue gradient) indicates the magnitude of attention weights, with darker blue representing higher values (closer to 1.0) and lighter blue/lighter shades representing lower values (closer to 0.5). A vertical black box highlights a specific region of interest.
---
### Components/Axes
- **X-axis (Token)**:
Labels include:
`last_q`, `first_answer`, `second_answer`, `exact_answer_before_first`, `exact_answer_first`, `exact_answer_last`, `exact_answer_after_last`.
Tokens are grouped into three sections:
1. **Left Section**: `last_q`, `first_answer`, `second_answer`
2. **Middle Section (Highlighted)**: `exact_answer_before_first` to `exact_answer_after_last`
3. **Right Section**: `exact_answer_last` (repeated 8 times, labeled 1–8).
- **Y-axis (Layer)**:
Layers range from 0 to 30, with increments of 2 (e.g., 0, 2, 4, ..., 30).
- **Color Scale (Legend)**:
A vertical color bar on the right maps values from **0.5 (lightest blue)** to **1.0 (darkest blue)**.
- **Highlighted Region**:
A black box spans layers 10–20 and tokens from `exact_answer_before_first` to `exact_answer_after_last`.
---
### Detailed Analysis
- **Token-Layer Distribution**:
- **Left Section (Tokens: `last_q`, `first_answer`, `second_answer`)**:
Attention weights are uniformly low (light blue), with values approximately **0.5–0.7** across all layers.
- **Middle Section (Highlighted Tokens)**:
- **Layers 10–20**: Darkest blue, indicating the highest attention weights (**~0.9–1.0**).
- **Layers 0–9 and 21–30**: Gradual decrease in intensity, with values dropping to **~0.6–0.8**.
- **Right Section (Tokens: `exact_answer_last` 1–8)**:
Attention weights are moderately low (**~0.6–0.8**) across all layers, with no significant variation.
- **Color Consistency**:
The legend confirms that darker blue corresponds to higher values. All data points in the middle section align with this scale.
---
### Key Observations
1. **Concentration of Attention**:
The model exhibits the strongest attention to tokens in the middle section (`exact_answer_before_first` to `exact_answer_after_last`) during layers 10–20.
2. **Layer-Specific Focus**:
Layers 10–20 are critical for processing exact answer tokens, while earlier and later layers show diminished focus.
3. **Uniformity in Context Tokens**:
Tokens like `last_q` and `first_answer` receive minimal attention across all layers.
4. **Repetition in Right Section**:
The repeated `exact_answer_last` tokens (1–8) show consistent but low attention, suggesting redundancy or lack of importance.
---
### Interpretation
The heatmap reveals that the model prioritizes the exact answer tokens (`exact_answer_before_first` to `exact_answer_after_last`) during mid-layers (10–20), likely reflecting a focus on precise information extraction. The decline in attention toward the ends of the token sequence (e.g., `last_q`, `exact_answer_last`) suggests that contextual or framing tokens are less critical for the model's decision-making. This pattern aligns with typical transformer architectures, where mid-layers often encode higher-level semantic information. The highlighted region underscores the model's reliance on specific tokens for accurate output, emphasizing the importance of attention mechanisms in capturing relevant data.