## Diagram: Word Embedding Transformation
### Overview
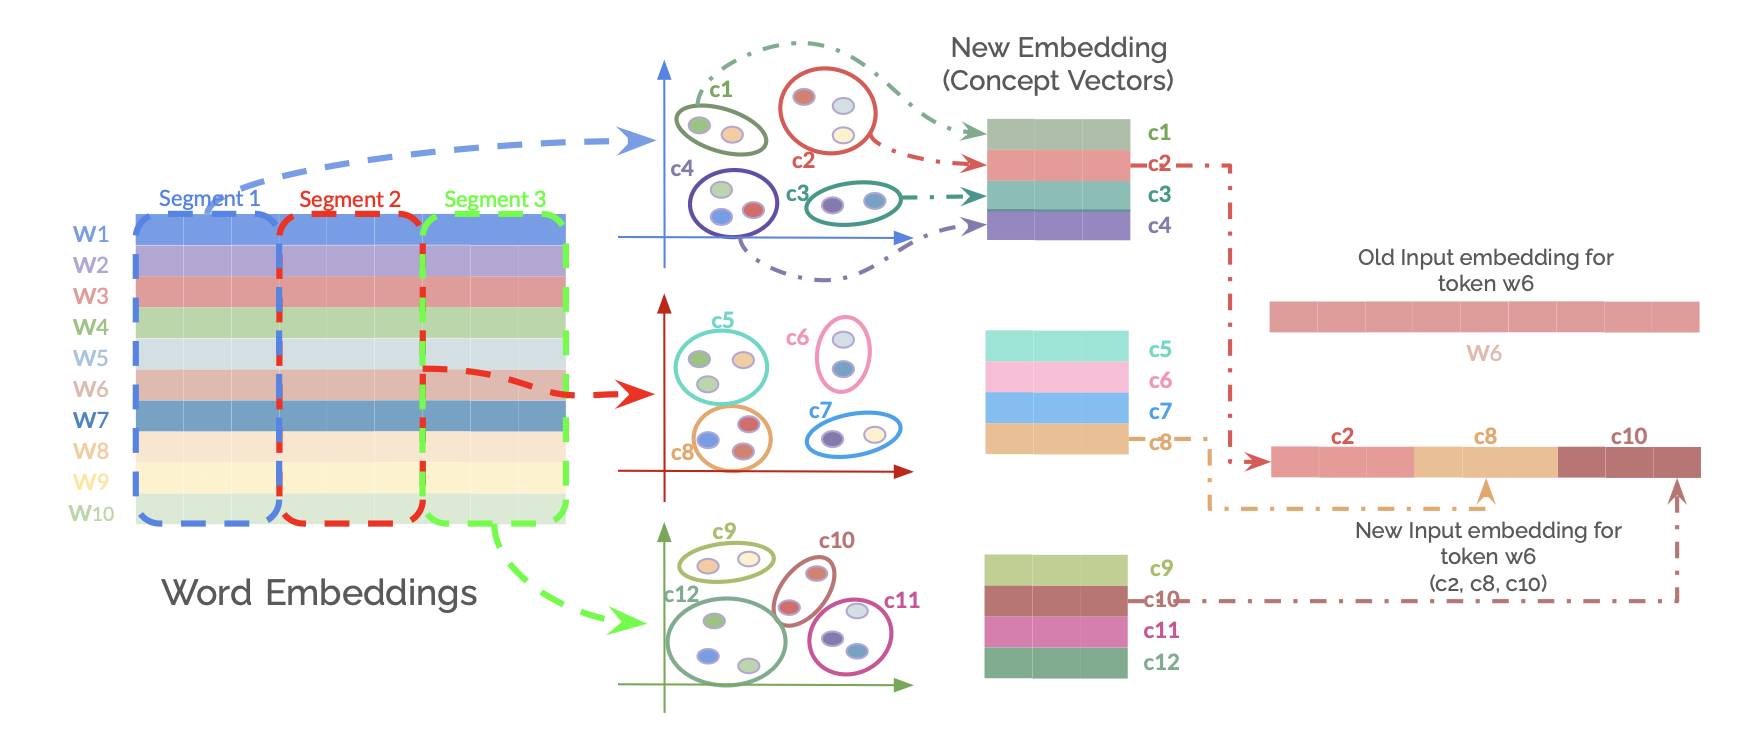
The image illustrates a transformation process of word embeddings into new embeddings based on concept vectors. It shows how initial word embeddings are segmented, clustered into concept groups, and then used to create new input embeddings for tokens.
### Components/Axes
* **Word Embeddings:** A grid representing word embeddings, with rows labeled W1 to W10. The grid is divided into three segments: Segment 1, Segment 2, and Segment 3.
* **Clustering Plots:** Three scatter plots showing clustering of concepts (c1-c12). Each plot has an x and y axis, but no labels are provided.
* **New Embedding (Concept Vectors):** Three stacked bar charts, each corresponding to one of the clustering plots. The bars are labeled c1-c4, c5-c8, and c9-c12.
* **Old Input embedding for token w6:** A horizontal bar representing the old input embedding for token w6.
* **New Input embedding for token w6 (c2, c8, c10):** A horizontal bar representing the new input embedding for token w6, composed of concepts c2, c8, and c10.
### Detailed Analysis
1. **Word Embeddings Grid:**
* The grid has 10 rows labeled W1 to W10.
* Segment 1 is outlined in blue, Segment 2 in red, and Segment 3 in green.
* Each row in the grid has a distinct color, representing the embedding vector for that word.
* The colors of the rows are approximately:
* W1: Light Blue
* W2: Red
* W3: Pink
* W4: Green
* W5: Light Green
* W6: Light Red
* W7: Blue
* W8: Yellow
* W9: Light Yellow
* W10: Light Blue
2. **Clustering Plots:**
* **Top Plot:** Clusters c1, c2, c3, and c4.
* c1: Contains two green and one brown data points.
* c2: Contains two red and one brown data points.
* c3: Contains two blue and one brown data points.
* c4: Contains two blue and one brown data points.
* **Middle Plot:** Clusters c5, c6, c7, and c8.
* c5: Contains two green and one brown data points.
* c6: Contains two pink data points.
* c7: Contains two blue and one brown data points.
* c8: Contains two brown and one red data points.
* **Bottom Plot:** Clusters c9, c10, c11, and c12.
* c9: Contains two yellow and one brown data points.
* c10: Contains two red and one brown data points.
* c11: Contains two purple and one brown data points.
* c12: Contains two blue and one green data points.
3. **New Embedding (Concept Vectors):**
* Each stacked bar chart corresponds to a clustering plot.
* The colors of the bars match the colors of the clusters in the corresponding plot.
* Top Chart: c1 (light green), c2 (red), c3 (purple), c4 (blue).
* Middle Chart: c5 (light green), c6 (pink), c7 (light blue), c8 (light brown).
* Bottom Chart: c9 (light green), c10 (red), c11 (pink), c12 (light green).
4. **Old and New Input Embeddings for Token w6:**
* The "Old Input embedding for token w6" is a single bar with a light red color.
* The "New Input embedding for token w6 (c2, c8, c10)" is a bar composed of three segments: c2 (red), c8 (light brown), and c10 (dark red).
### Key Observations
* The word embeddings are segmented and then clustered into concept groups.
* The new embeddings are created by combining the concept vectors from the clustering plots.
* The example shows how the old embedding for token w6 is transformed into a new embedding based on concepts c2, c8, and c10.
### Interpretation
The diagram illustrates a method for transforming word embeddings by clustering them into concept groups and then creating new embeddings based on these concepts. This approach allows for a more nuanced representation of words, capturing different aspects or meanings based on the context. The example of token w6 shows how the original embedding is replaced by a combination of concept vectors, potentially leading to improved performance in downstream tasks. The segmentation of the initial word embeddings suggests that different segments may contribute to different concept clusters.