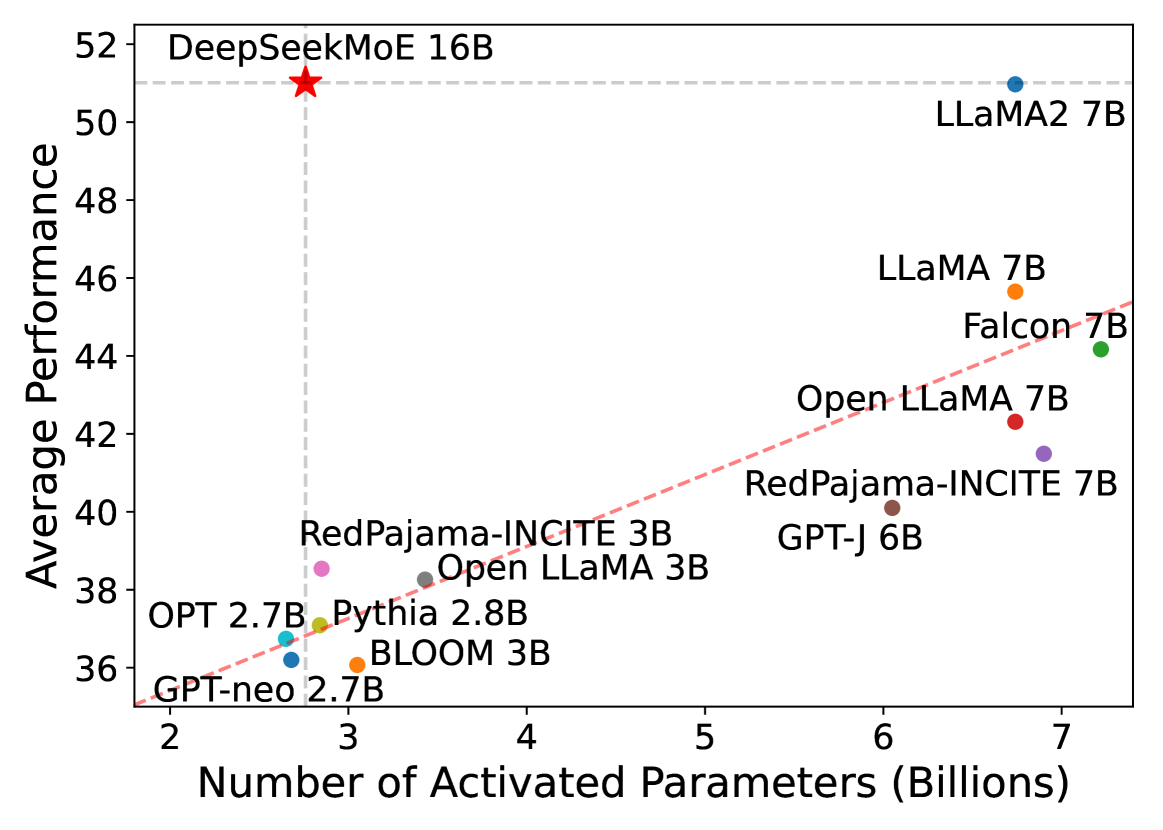
# Chart Analysis: Model Performance vs. Activated Parameters
## Chart Type
Scatter plot with a trend line.
## Axes
- **X-axis**: "Number of Activated Parameters (Billions)"
- Range: 2 to 7 billion
- Tick marks: 2, 3, 4, 5, 6, 7
- **Y-axis**: "Average Performance"
- Range: 36 to 52
- Tick marks: 36, 38, 40, 42, 44, 46, 48, 50, 52
- Horizontal dashed line at **51** (benchmark)
## Data Points
Each point represents a model with its parameter count and performance. Labels include:
1. **GPT-neo 2.7B** (2.7B parameters, 36 performance)
2. **OPT 2.7B** (2.7B parameters, 37 performance)
3. **Pythia 2.8B** (2.8B parameters, 37 performance)
4. **BLOOM 3B** (3B parameters, 37 performance)
5. **RedPajama-INCITE 3B** (3B parameters, 38 performance)
6. **Open LLaMA 3B** (3B parameters, 38 performance)
7. **GPT-J 6B** (6B parameters, 40 performance)
8. **RedPajama-INCITE 7B** (7B parameters, 42 performance)
9. **LLaMA 7B** (7B parameters, 44 performance)
10. **Falcon 7B** (7B parameters, 44 performance)
11. **LLaMA2 7B** (7B parameters, 51 performance)
12. **DeepSeekMoE 16B** (16B parameters, 51 performance, marked with a red star)
## Trend Line
- **Dashed red line** indicating a positive correlation between activated parameters and average performance.
- The line passes through key data points (e.g., GPT-neo 2.7B, LLaMA2 7B, DeepSeekMoE 16B).
## Key Observations
- **Highest Performance**: DeepSeekMoE 16B (51) and LLaMA2 7B (51) achieve the highest average performance.
- **Benchmark**: The horizontal dashed line at 51 serves as a performance threshold.
- **Parameter-Size Correlation**: Larger models (e.g., 7B, 16B) generally outperform smaller ones (e.g., 2.7B, 3B).
- **Outliers**: Some models (e.g., GPT-J 6B, RedPajama-INCITE 7B) show performance gaps relative to their parameter size.
## Notes
- No explicit legend is present, but colors differentiate data points.
- The chart emphasizes the trade-off between model size and performance, with the trend line suggesting scalability benefits.