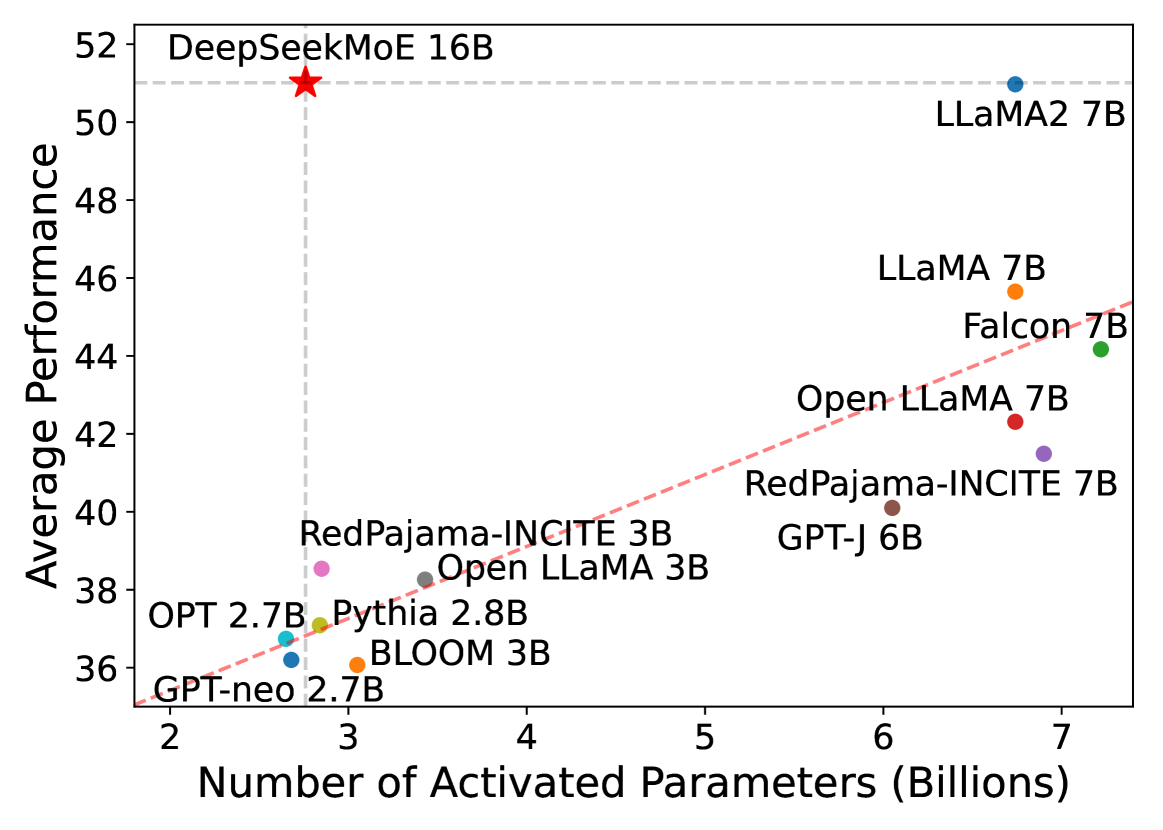
# Technical Document Extraction: Model Performance vs. Activated Parameters
## 1. Image Overview
This image is a scatter plot comparing various Large Language Models (LLMs) based on their computational efficiency. It plots the **Average Performance** (y-axis) against the **Number of Activated Parameters in Billions** (x-axis).
## 2. Axis and Scale Information
* **Y-Axis Label:** Average Performance
* **Range:** 36 to 52 (increments of 2).
* **X-Axis Label:** Number of Activated Parameters (Billions)
* **Range:** 2 to 7 (increments of 1).
* **Grid Lines:**
* A horizontal dashed light-grey line is positioned at approximately **y = 51.0**.
* A vertical dashed light-grey line is positioned at approximately **x = 2.8**.
* A diagonal red dashed trend line originates near [x=1.8, y=35] and slopes upward toward the top right, representing the general scaling law of performance relative to parameter count for standard models.
## 3. Data Points and Categorization
The chart contains 12 distinct data points representing different AI models.
### High-Efficiency Outlier (Top Left)
* **Model:** DeepSeekMoE 16B
* **Symbol:** Large Red Star
* **Coordinates:** [~2.8, ~51.0]
* **Trend Analysis:** This model is a significant outlier. While it has 16B total parameters, it only activates ~2.8B. Its performance is nearly equal to the highest-performing model on the chart (LLaMA2 7B) despite using less than half the activated parameters.
### Standard Scaling Models (Clustered along the Red Trend Line)
These models generally follow the upward-sloping red dashed line, indicating that as activated parameters increase, performance increases.
| Model Name | Color | Approx. Activated Parameters (X) | Approx. Avg. Performance (Y) |
| :--- | :--- | :--- | :--- |
| **LLaMA2 7B** | Blue | 6.7 | 51.0 |
| **LLaMA 7B** | Orange | 6.7 | 45.7 |
| **Falcon 7B** | Green | 7.2 | 44.2 |
| **Open LLaMA 7B** | Red | 6.7 | 42.3 |
| **RedPajama-INCITE 7B** | Purple | 6.9 | 41.5 |
| **GPT-J 6B** | Brown | 6.1 | 40.1 |
| **RedPajama-INCITE 3B** | Pink | 2.8 | 38.5 |
| **Open LLaMA 3B** | Grey | 3.4 | 38.2 |
| **Pythia 2.8B** | Olive | 2.8 | 37.1 |
| **OPT 2.7B** | Cyan | 2.6 | 36.8 |
| **BLOOM 3B** | Orange | 3.1 | 36.1 |
| **GPT-neo 2.7B** | Blue | 2.7 | 36.2 |
## 4. Component Isolation & Spatial Grounding
* **Header/Title:** None present in the image.
* **Main Chart Area:** Occupies the entire frame.
* **Legend:** There is no formal legend box. Instead, labels are placed directly adjacent to their respective data points.
* **Key Visual Logic:** The intersection of the vertical and horizontal dashed lines highlights **DeepSeekMoE 16B** as the focal point, demonstrating that it achieves "7B-class" performance (matching LLaMA2 7B) with only "3B-class" activated parameters (matching RedPajama-INCITE 3B).
## 5. Summary of Findings
The data visualizes the efficiency of Mixture-of-Experts (MoE) architecture. While most dense models (LLaMA, Falcon, GPT-J) follow a linear scaling trend where more parameters equal better performance, **DeepSeekMoE 16B** breaks this trend by achieving high-tier performance (51.0) while maintaining a low computational footprint (2.8B activated parameters).