\n
## Charts: MMLU Law Probability Distributions
### Overview
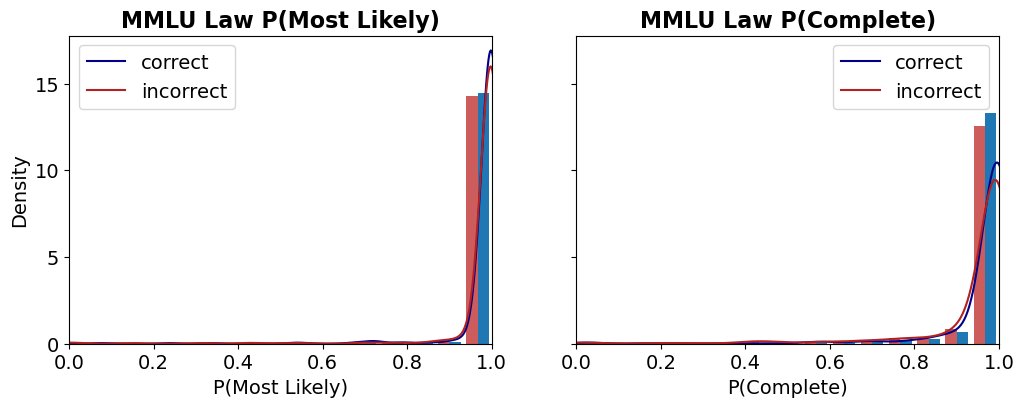
The image presents two density plots, side-by-side, comparing the distributions of probabilities for "correct" and "incorrect" answers on the MMLU (Massive Multitask Language Understanding) Law benchmark. The left plot shows the distribution of P(Most Likely), while the right plot shows the distribution of P(Complete). Both plots use density as the y-axis and probability as the x-axis.
### Components/Axes
Each chart shares the following components:
* **Title:** "MMLU Law P(Most Likely)" (left) and "MMLU Law P(Complete)" (right) positioned at the top-center.
* **X-axis Label:** "P(Most Likely)" (left) and "P(Complete)" (right)
* **Y-axis Label:** "Density"
* **X-axis Scale:** Ranges from 0.0 to 1.0, with tick marks at 0.2, 0.4, 0.6, 0.8, and 1.0.
* **Y-axis Scale:** Ranges from 0.0 to approximately 15.0, with tick marks at 0, 5, 10, and 15.
* **Legend:** Located in the top-left corner of each chart.
* "correct" - represented by a dark blue line.
* "incorrect" - represented by a dark red line.
### Detailed Analysis
**Chart 1: MMLU Law P(Most Likely)**
* **Correct (Blue Line):** The density distribution for correct answers shows a strong peak very close to 1.0. The line rises sharply from approximately 0.85 to 1.0, reaching a maximum density of approximately 14 at a probability of 1.0. There is minimal density for probabilities below 0.85.
* **Incorrect (Red Line):** The density distribution for incorrect answers also peaks near 1.0, but is more spread out than the "correct" distribution. The peak is around 0.95, with a maximum density of approximately 12. There is a noticeable tail extending from approximately 0.7 to 0.85, indicating some incorrect answers have lower probabilities.
**Chart 2: MMLU Law P(Complete)**
* **Correct (Blue Line):** The density distribution for correct answers is highly concentrated near 1.0. The line rises sharply from approximately 0.85 to 1.0, reaching a maximum density of approximately 15 at a probability of 1.0. There is very little density for probabilities below 0.85.
* **Incorrect (Red Line):** The density distribution for incorrect answers is also centered around 1.0, but is broader and has a more pronounced tail than the "correct" distribution. The peak is around 0.95, with a maximum density of approximately 13. There is a noticeable tail extending from approximately 0.7 to 0.9, indicating some incorrect answers have lower probabilities.
### Key Observations
* In both charts, the density is significantly higher for probabilities close to 1.0 for both correct and incorrect answers.
* The "correct" answers tend to have a sharper, more concentrated distribution around 1.0 compared to "incorrect" answers.
* The "incorrect" answers exhibit a wider distribution and a longer tail towards lower probabilities, suggesting that incorrect answers are more likely to have lower confidence scores (as indicated by the probability).
* The distributions for both "correct" and "incorrect" answers are heavily skewed towards higher probabilities.
### Interpretation
These charts demonstrate the relationship between the predicted probability (P(Most Likely) and P(Complete)) and the correctness of the answers on the MMLU Law benchmark. The data suggests that higher predicted probabilities are generally associated with correct answers, but this association is not perfect.
The sharper distribution of probabilities for correct answers indicates that the model is more confident in its correct predictions. The broader distribution and tail for incorrect answers suggest that the model sometimes assigns high probabilities to incorrect answers, or that incorrect answers can have a wider range of confidence scores.
The fact that both distributions are heavily skewed towards 1.0 suggests that the model generally assigns high probabilities to its predictions, even when they are incorrect. This could indicate a tendency for overconfidence.
The difference between P(Most Likely) and P(Complete) could be related to the completeness of the answer. P(Complete) might be a more robust metric, as it considers the entire answer, while P(Most Likely) only considers the most probable token. The similarity in the distributions suggests that both metrics provide similar information about the model's confidence and accuracy.