## Line Graph: Gaussian VS Diffusion
### Overview
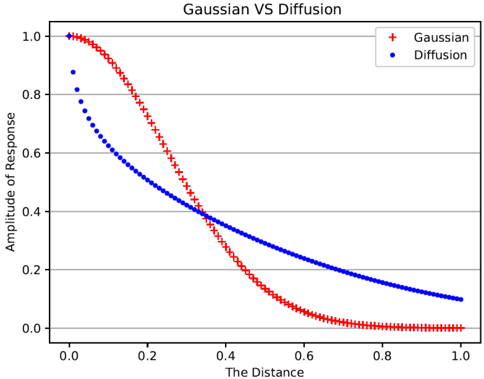
The image is a line graph comparing two decaying response amplitudes over normalized distance. Two data series are plotted: "Gaussian" (red crosses) and "Diffusion" (blue dots). Both series show decreasing amplitude as distance increases, with a notable crossover point where the Gaussian response falls below the Diffusion response.
### Components/Axes
- **Title**: "Gaussian VS Diffusion" (centered at top)
- **X-axis**: "The Distance" (0.0 to 1.0 in increments of 0.2)
- **Y-axis**: "Amplitude of Response" (0.0 to 1.0 in increments of 0.2)
- **Legend**: Top-right corner, with red "+" for Gaussian and blue "•" for Diffusion
- **Gridlines**: Horizontal and vertical, spaced at 0.2 intervals
### Detailed Analysis
1. **Gaussian Response (Red Crosses)**:
- Starts at (0.0, 1.0) with maximum amplitude.
- Decays rapidly, crossing the Diffusion curve at ~0.3 on the x-axis.
- Reaches ~0.02 amplitude at x=1.0.
- Trend: Steep initial decline, then gradual flattening.
2. **Diffusion Response (Blue Dots)**:
- Starts at (0.0, 0.85) with slightly lower initial amplitude.
- Decays more gradually than Gaussian.
- Maintains ~0.1 amplitude at x=1.0.
- Trend: Slow, linear-like decline.
3. **Crossover Point**:
- Occurs at ~0.3 on the x-axis.
- At this point, Gaussian amplitude ≈0.5, Diffusion ≈0.55.
### Key Observations
- The Gaussian response decays faster initially but stabilizes at lower amplitudes.
- The Diffusion response maintains higher amplitudes over longer distances.
- Both series exhibit monotonic decay with no oscillations.
### Interpretation
The graph suggests fundamentally different decay mechanisms:
1. **Gaussian Behavior**:
- Rapid initial attenuation (characteristic of localized phenomena like heat diffusion in confined spaces).
- Early crossover implies sensitivity to short-range interactions.
2. **Diffusion Behavior**:
- Sustained amplitude retention (typical of distributed systems with gradual energy dissipation).
- Linear-like decay suggests first-order diffusion processes.
The crossover at ~0.3 distance units may represent a critical threshold where system dynamics shift from localized to distributed behavior. This could have implications in fields like signal processing (filter response characteristics) or physics (particle dispersion models). The stark contrast in decay rates highlights the importance of system boundary conditions in determining response profiles.