## Line Chart: Normalized Mean Test Loss vs. Global Algorithmic Time
### Overview
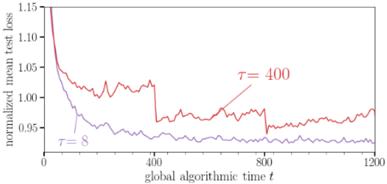
The image is a line chart comparing the normalized mean test loss over global algorithmic time for two different parameter settings, denoted as τ = 8 and τ = 400. The chart illustrates how the test loss changes as the algorithm progresses, with each line representing a different configuration.
### Components/Axes
* **X-axis:** "global algorithmic time t". The scale ranges from 0 to 1200, with tick marks at 0, 400, 800, and 1200.
* **Y-axis:** "normalized mean test loss". The scale ranges from 0.90 to 1.15, with tick marks at 0.95, 1.00, 1.05, 1.10, and 1.15.
* **Legend:**
* τ = 8 (purple line) - Located on the left side of the chart, near the middle.
* τ = 400 (red line) - Located in the upper-middle part of the chart.
### Detailed Analysis
* **τ = 8 (purple line):**
* Trend: The line starts at approximately 1.05 and slopes downward rapidly initially, then gradually decreases and stabilizes around 0.92 after approximately 400 units of global algorithmic time.
* Data Points:
* t = 0, loss ≈ 1.05
* t = 400, loss ≈ 0.93
* t = 1200, loss ≈ 0.92
* **τ = 400 (red line):**
* Trend: The line starts at approximately 1.15 and slopes downward rapidly initially, then fluctuates between 0.95 and 1.03 after approximately 400 units of global algorithmic time. There are noticeable jumps in the loss around t = 400 and t = 800.
* Data Points:
* t = 0, loss ≈ 1.15
* t = 400, loss ≈ 1.03
* t = 800, loss ≈ 0.95
* t = 1200, loss ≈ 0.97
### Key Observations
* The normalized mean test loss decreases over time for both parameter settings.
* The parameter setting τ = 8 results in a lower and more stable test loss compared to τ = 400.
* The parameter setting τ = 400 exhibits more fluctuation and instability in the test loss.
### Interpretation
The chart demonstrates the impact of different parameter settings (τ = 8 and τ = 400) on the performance of a machine learning algorithm, as measured by the normalized mean test loss. The lower and more stable test loss achieved with τ = 8 suggests that this parameter setting leads to better convergence and generalization performance. The fluctuations and jumps observed with τ = 400 indicate potential instability or sensitivity to the training data. The initial rapid decrease in test loss for both settings indicates that the algorithm is learning effectively at the beginning of the training process. The stabilization of the test loss after a certain point suggests that the algorithm has reached a point of diminishing returns, where further training does not significantly improve performance.