\n
## Line Chart: Normalized Mean Test Loss vs. Global Algorithmic Time
### Overview
This image presents a line chart illustrating the relationship between normalized mean test loss and global algorithmic time for two different values of τ (tau). The chart appears to be evaluating the performance of an algorithm over time, with the loss function indicating the error rate.
### Components/Axes
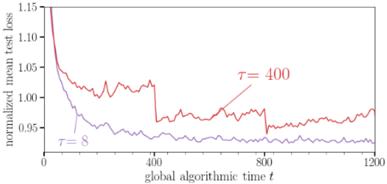
* **X-axis:** "global algorithmic time t" - Scale ranges from 0 to 1200, with markings at 0, 400, 800, and 1200.
* **Y-axis:** "normalized mean test loss" - Scale ranges from 0.94 to 1.15, with markings at 0.95, 1.00, 1.05, and 1.10, 1.15.
* **Line 1 (Red):** Labeled "τ = 400". This line represents the normalized mean test loss for τ equal to 400.
* **Line 2 (Purple):** Labeled "τ = 8". This line represents the normalized mean test loss for τ equal to 8.
### Detailed Analysis
* **Line τ = 400 (Red):** The line starts at approximately 1.15 at t=0 and rapidly decreases to around 1.02 by t=100. It then fluctuates between approximately 0.98 and 1.05 until t=400. After t=400, the line exhibits a noticeable increase, reaching a peak of approximately 1.08 at t=500, then fluctuates between 0.98 and 1.05 until t=1200.
* **Line τ = 8 (Purple):** The line starts at approximately 1.04 at t=0 and steadily decreases to around 0.95 by t=100. It continues to fluctuate around 0.95, with minor variations, until t=1200. The line remains relatively stable throughout the entire duration.
### Key Observations
* The algorithm with τ = 8 consistently exhibits a lower normalized mean test loss compared to the algorithm with τ = 400.
* The algorithm with τ = 400 experiences a significant increase in loss around t = 400, suggesting a potential instability or change in behavior.
* The algorithm with τ = 8 demonstrates a more stable and consistent performance over time.
### Interpretation
The chart suggests that the parameter τ significantly impacts the performance of the algorithm. A smaller value of τ (τ = 8) leads to a more stable and lower loss, indicating better performance. The sudden increase in loss for τ = 400 around t = 400 could indicate a point where the algorithm encounters difficulties, such as getting stuck in a local minimum or diverging. This could be due to the algorithm's sensitivity to the value of τ, or it could be a result of the specific dataset or problem being solved. The consistent performance of τ = 8 suggests it is a more robust parameter setting for this particular algorithm and task. Further investigation would be needed to understand the underlying reasons for the observed differences and to optimize the value of τ for optimal performance.