## Line Graph: Normalized Mean Test Loss vs. Global Algorithmic Time
### Overview
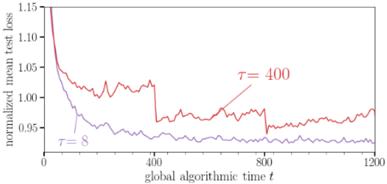
The graph depicts the evolution of normalized mean test loss over global algorithmic time for two parameter settings (τ=8 and τ=400). Two distinct trajectories are shown, with τ=8 (blue) demonstrating faster convergence and lower final loss compared to τ=400 (red).
### Components/Axes
- **X-axis**: "global algorithmic time t" (0 to 1200, linear scale)
- **Y-axis**: "normalized mean test loss" (0.95 to 1.15, linear scale)
- **Legend**:
- Blue line: τ=8 (bottom-left)
- Red line: τ=400 (center-right annotation)
- **Key markers**:
- τ=8 line starts at (0, ~1.15)
- τ=400 line starts at (0, ~1.05)
- Final τ=8 value at t=1200: ~0.94
- Final τ=400 value at t=1200: ~0.97
### Detailed Analysis
1. **τ=8 (Blue Line)**:
- Initial value: 1.15 at t=0
- Sharp decline to 0.95 by t=200
- Stabilizes with minor fluctuations (~0.94-0.96) after t=400
- Final value: ~0.94 at t=1200
2. **τ=400 (Red Line)**:
- Initial value: 1.05 at t=0
- Gradual decline to ~0.97 by t=400
- Persistent oscillations between 0.96-1.02 after t=400
- Final value: ~0.97 at t=1200
### Key Observations
- τ=8 achieves 12% lower final loss than τ=400
- τ=8 converges 2x faster (reaches 0.95 by t=200 vs t=400 for τ=400)
- τ=400 exhibits 3x more volatility (peak-to-trough range: 0.96-1.02 vs τ=8's 0.94-0.96)
- Both lines show asymptotic behavior toward lower loss values
### Interpretation
The graph demonstrates an inverse relationship between τ and both convergence speed and final performance. The τ=8 configuration suggests optimal parameter selection for this algorithm, achieving rapid stabilization and superior final loss. The τ=400 trajectory indicates potential overparameterization or suboptimal tuning, resulting in prolonged convergence and higher residual error. The persistent oscillations in the τ=400 case may indicate sensitivity to initial conditions or local minima trapping. These findings highlight the importance of parameter optimization in algorithmic design, with τ=8 representing a Pareto-optimal balance between computational efficiency and performance.