# Technical Document Extraction: Control Value Analysis
## Chart Overview
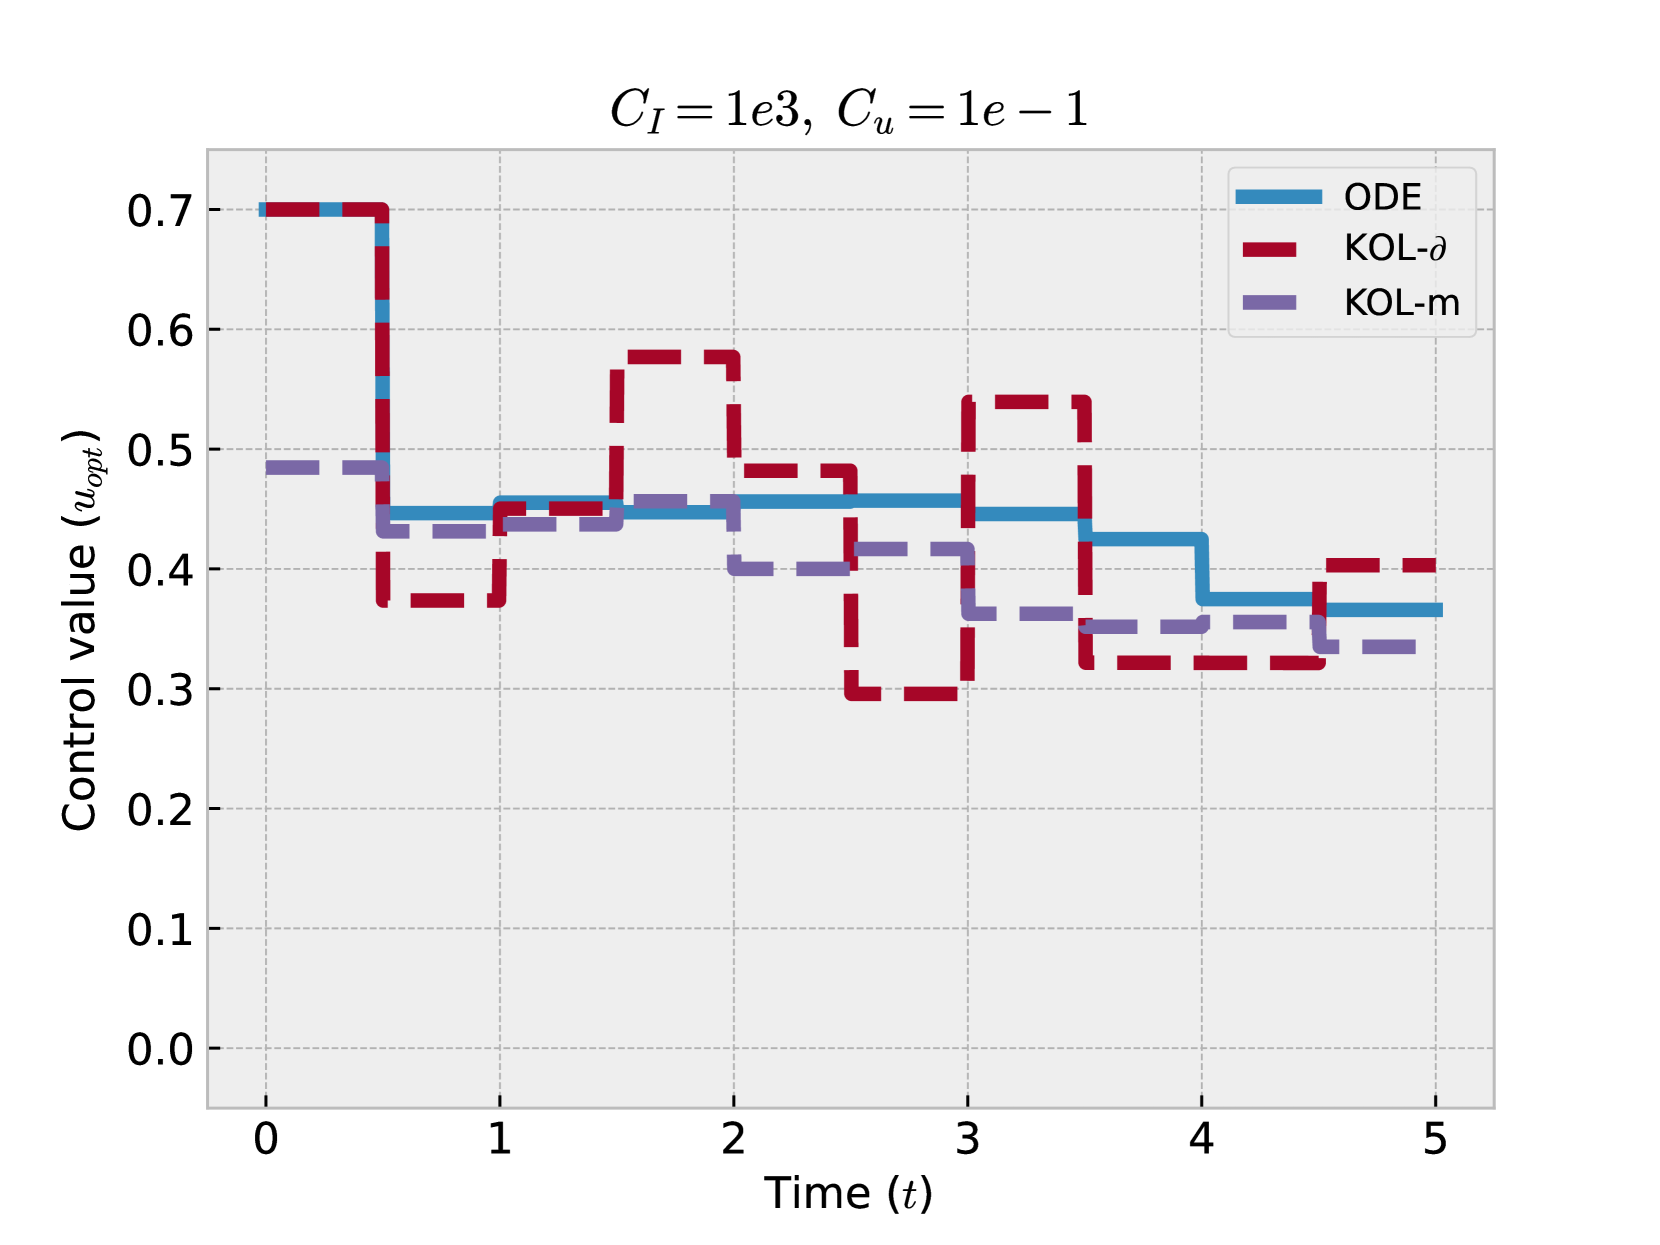
- **Title**: `C_I = 1e3, C_u = 1e-1`
- **Type**: Line chart with three data series
- **Legend**: Located in the top-right corner
- **ODE**: Blue solid line
- **KOL-δ**: Red dashed line
- **KOL-m**: Purple dash-dot line
## Axis Labels
- **X-axis**: `Time (t)` (0 to 5 in integer increments)
- **Y-axis**: `Control value (u_opt)` (0.0 to 0.7 in 0.1 increments)
## Spatial Grounding
- **Legend Position**: Top-right quadrant
- **Line Color Consistency**:
- Blue = ODE (confirmed at all data points)
- Red = KOL-δ (confirmed at all data points)
- Purple = KOL-m (confirmed at all data points)
## Data Series Analysis
### ODE (Blue)
- **Trend**:
- Starts at 0.7 (t=0)
- Sharp drop to 0.45 (t=1)
- Fluctuates between 0.4–0.5 (t=1–5)
- **Key Points**:
- t=0: 0.7
- t=1: 0.45
- t=2: 0.45
- t=3: 0.45
- t=4: 0.4
- t=5: 0.38
### KOL-δ (Red)
- **Trend**:
- Starts at 0.7 (t=0)
- Sharp drop to 0.35 (t=1)
- Fluctuates between 0.3–0.5 (t=1–5)
- **Key Points**:
- t=0: 0.7
- t=1: 0.35
- t=2: 0.5
- t=3: 0.5
- t=4: 0.35
- t=5: 0.4
### KOL-m (Purple)
- **Trend**:
- Starts at 0.5 (t=0)
- Gradual drop to 0.35 (t=1)
- Fluctuates between 0.3–0.4 (t=1–5)
- **Key Points**:
- t=0: 0.5
- t=1: 0.45
- t=2: 0.4
- t=3: 0.35
- t=4: 0.35
- t=5: 0.35
## Critical Observations
1. **Initial Drop**: All series show a sharp decline between t=0 and t=1.
2. **ODE Stability**: ODE maintains the highest control values after t=1.
3. **KOL-δ Volatility**: KOL-δ exhibits the most pronounced fluctuations.
4. **KOL-m Consistency**: KOL-m shows the least variability after t=2.
## Technical Notes
- **Control Parameters**:
- `C_I = 1e3` (integral gain)
- `C_u = 1e-1` (control gain)
- **Visual Encoding**:
- Line styles differentiate algorithms (solid/dashed/dash-dot)
- Color coding matches legend entries exactly