## Textual Data Extraction: Activity Transition Counts
### Overview
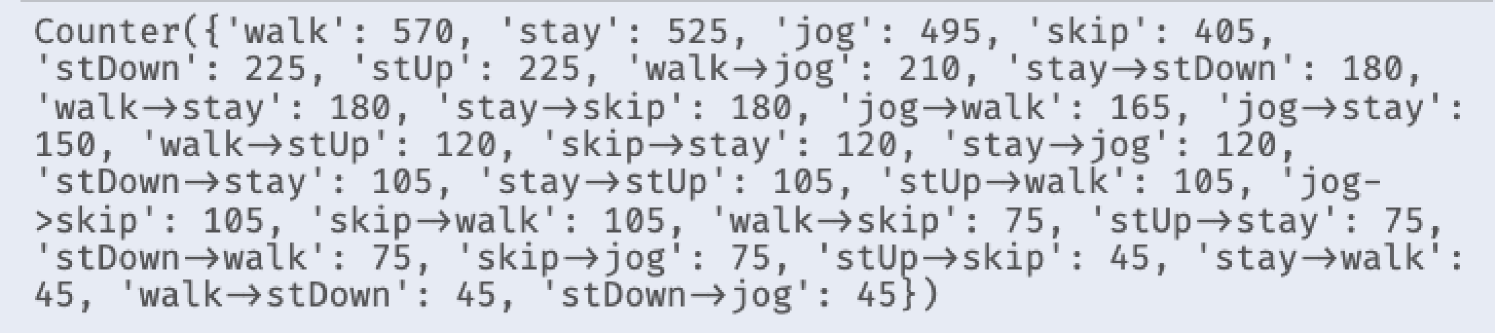
The image contains a block of text representing a data structure, likely a dictionary or a map, that enumerates counts for various activities and transitions between activities. The data is presented in a key-value format, where the keys are strings representing activities or transitions (e.g., 'walk', 'stay', 'walk->jog'), and the values are integers representing the frequency or count of those activities/transitions.
### Components/Axes
This is not a chart or diagram, but a direct transcription of textual data. There are no explicit axes, legends, or labels in the conventional sense. The data is structured as a series of key-value pairs within a `Counter` object.
### Content Details
The following key-value pairs were extracted:
* **Single Activities:**
* 'walk': 570
* 'stay': 525
* 'jog': 495
* 'skip': 405
* 'stDown': 225
* 'stUp': 225
* **Transitions (from -> to):**
* 'walk->jog': 210
* 'stay->stDown': 180
* 'walk->stay': 180
* 'stay->skip': 180
* 'jog->walk': 165
* 'jog->stay': 150
* 'walk->stUp': 120
* 'skip->stay': 120
* 'stay->jog': 120
* 'stDown->stay': 105
* 'stay->stUp': 105
* 'stUp->walk': 105
* 'jog->skip': 105
* 'skip->walk': 105
* 'walk->skip': 75
* 'stUp->stay': 75
* 'stDown->walk': 75
* 'skip->jog': 75
* 'stUp->skip': 45
* 'stay->walk': 45
* 'walk->stDown': 45
* 'stDown->jog': 45
### Key Observations
* **Most Frequent Single Activity:** 'walk' with a count of 570.
* **Least Frequent Single Activity:** 'skip' with a count of 405.
* **Most Frequent Transition:** 'walk->jog' with a count of 210.
* **Least Frequent Transitions:** Several transitions have the lowest count of 45, including 'stUp->skip', 'stay->walk', 'walk->stDown', and 'stDown->jog'.
* **Symmetry in Transitions:** Some transitions appear to have symmetrical counts (e.g., 'walk->stay' is 180, and 'stay->walk' is 45, indicating asymmetry). However, 'stay->stDown' (180) and 'stDown->stay' (105) show a difference. 'stay->skip' (180) and 'skip->stay' (120) also show a difference.
* **Activity vs. Transition Counts:** The counts for single activities are generally higher than the counts for transitions, which is expected as transitions represent a change from one state to another, implying a preceding state.
### Interpretation
This data likely represents the output of a system that tracks user activity or state changes over time. The `Counter` object suggests a tally of occurrences.
* **Activity Distribution:** The counts for single activities ('walk', 'stay', 'jog', 'skip', 'stDown', 'stUp') indicate the overall prevalence of each activity. 'walk' and 'stay' are the most common states.
* **Transition Dynamics:** The transition counts reveal how frequently users move between different activities. For example, the high count for 'walk->jog' (210) suggests that transitioning from walking to jogging is a common behavior. Conversely, transitions with lower counts might represent less frequent or more specific behavioral patterns.
* **Behavioral Patterns:** By analyzing these transition probabilities (counts divided by the total occurrences of the originating activity), one could infer behavioral patterns. For instance, if 'walk->stay' is high and 'stay->walk' is low, it might suggest that once a user stops walking to stay, they are less likely to resume walking immediately.
* **Potential Applications:** This type of data is crucial for applications involving activity recognition, user behavior modeling, predictive analytics, and personalized user experiences. It could be used to train machine learning models to predict the next activity or to understand user engagement patterns. The presence of 'stDown' and 'stUp' suggests these might represent standing down and standing up, or perhaps specific types of movement like stairs. The distinct counts for transitions like 'walk->stDown' (45) versus 'stDown->walk' (75) could indicate different probabilities of initiating or resuming these actions.