\n
## Text Block: Counter Data
### Overview
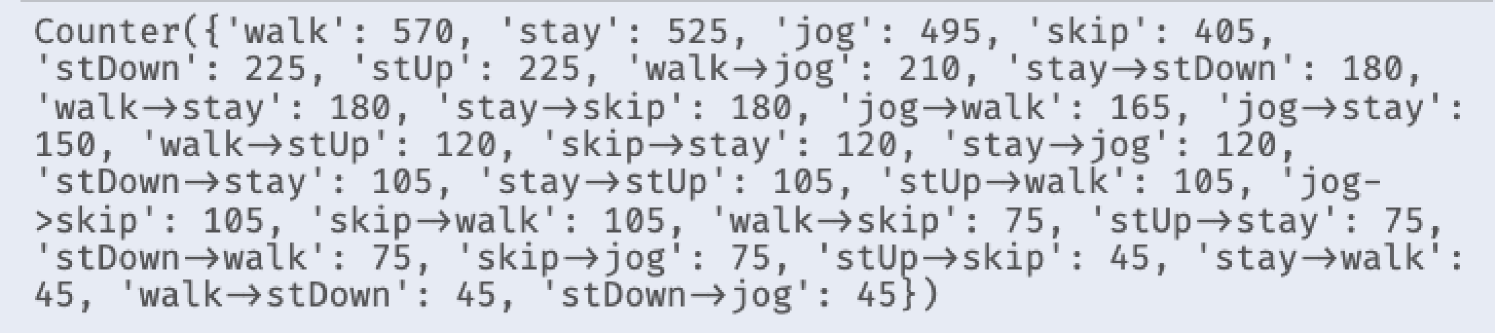
The image presents a textual output representing a counter, likely from a program or script, detailing the frequency of various actions or state transitions. The output is formatted as a Python dictionary-like string.
### Components/Axes
There are no axes or components in the traditional sense of a chart or diagram. The data is presented as key-value pairs, where the keys represent actions or transitions, and the values represent their counts.
### Detailed Analysis or Content Details
The counter data can be reconstructed as follows:
* 'walk': 570
* 'stay': 525
* 'jog': 495
* 'skip': 405
* 'stDown': 225
* 'stUp': 225
* 'walk->jog': 210
* 'stay->stDown': 180
* 'walk->stay': 180
* 'stay->skip': 180
* 'jog->walk': 165
* 'jog->stay': 150
* 'walk->stUp': 120
* 'skip->stay': 120
* 'stay->jog': 120
* 'stDown->stay': 105
* 'stay->stUp': 105
* 'stUp->walk': 105
* 'jog->skip': 105
* 'skip->walk': 105
* 'walk->skip': 75
* 'stUp->stay': 75
* 'stDown->walk': 75
* 'skip->jog': 75
* 'stUp->skip': 45
* 'stay->walk': 45
* 'walk->stDown': 45
* 'stDown->jog': 45
### Key Observations
The most frequent actions are 'walk' (570), 'stay' (525), and 'jog' (495). The least frequent actions/transitions are several with a count of 45. Transitions involving 'walk' and 'stay' appear relatively common.
### Interpretation
This data likely represents a log of actions or state changes within a system, potentially a simulation or a recording of user behavior. The high counts for 'walk', 'stay', and 'jog' suggest these are the most common activities. The transitions between states (e.g., 'walk->jog') provide insight into the flow or sequence of actions. The data could be used to analyze patterns of behavior, identify common pathways, or evaluate the performance of a system. The presence of transitions suggests a state machine or similar model is being used. The counts could be used to build a Markov chain model to predict future states.