\n
## Data Table: Activity and Transition Frequency Counter
### Overview
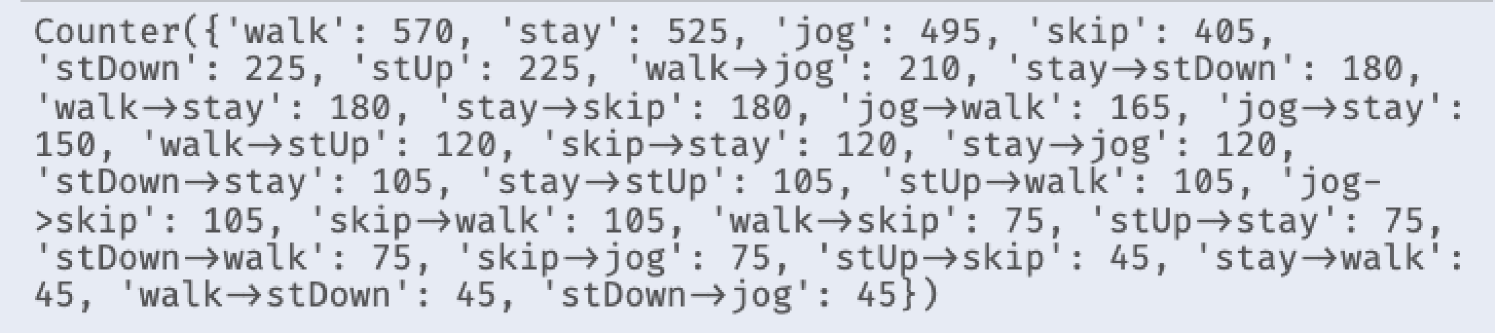
The image displays the output of a Python `Counter` object, which is a dictionary subclass for counting hashable objects. It presents a frequency distribution of discrete activities and transitions between those activities. The data appears to be from a dataset tracking human movement or exercise patterns.
### Components/Axes
* **Format:** A single line of text formatted as a Python `Counter` object.
* **Language:** English. The text uses standard English activity names and the arrow symbol (`→`) to denote a transition from one state to another.
* **Structure:** A set of key-value pairs enclosed in curly braces `{}`. Each key is a string representing an activity or a transition, and each value is an integer representing its count or frequency.
* **Data Keys:**
* **Single Activities:** `walk`, `stay`, `jog`, `skip`, `stDown`, `stUp`.
* **Transitions:** Formatted as `[activity1]→[activity2]`, e.g., `walk→jog`, `stay→stDown`.
### Detailed Analysis
The following is a complete transcription of all key-value pairs from the Counter, listed in descending order of frequency as they appear in the image.
**Single Activity Counts:**
1. `walk`: 570
2. `stay`: 525
3. `jog`: 495
4. `skip`: 405
5. `stDown`: 225
6. `stUp`: 225
**Transition Counts (from highest to lowest frequency):**
1. `walk→jog`: 210
2. `stay→stDown`: 180
3. `walk→stay`: 180
4. `stay→skip`: 180
5. `jog→walk`: 165
6. `jog→stay`: 150
7. `walk→stUp`: 120
8. `skip→stay`: 120
9. `stay→jog`: 120
10. `stDown→stay`: 105
11. `stay→stUp`: 105
12. `stUp→walk`: 105
13. `jog→skip`: 105
14. `skip→walk`: 105
15. `walk→skip`: 75
16. `stUp→stay`: 75
17. `stDown→walk`: 75
18. `skip→jog`: 75
19. `stUp→skip`: 45
20. `stay→walk`: 45
21. `walk→stDown`: 45
22. `stDown→jog`: 45
### Key Observations
* **Activity Hierarchy:** The single activity `walk` is the most frequent state (570), followed closely by `stay` (525). The least frequent single states are the postural transitions `stDown` and `stUp`, which have identical counts (225).
* **Transition Patterns:** The most common transition is from `walk` to `jog` (210). There is a three-way tie for the second-most common transition at 180 counts: `stay→stDown`, `walk→stay`, and `stay→skip`.
* **Symmetry and Asymmetry:** Some transitions are symmetric in count but not in direction. For example, `walk→stay` (180) is much more frequent than `stay→walk` (45). Conversely, `stDown→stay` (105) and `stay→stUp` (105) have equal counts.
* **Low-Frequency Transitions:** The least frequent transitions, all with 45 counts, involve movements to or from `stDown` and `stUp` (e.g., `stUp→skip`, `stay→walk`, `walk→stDown`, `stDown→jog`).
### Interpretation
This data suggests a structured observation of movement patterns, likely from a video analysis, sensor data, or annotated dataset. The high counts for `walk` and `stay` indicate these are the primary, sustained states. The transitions represent the moments of change between these states.
The frequency hierarchy implies a logical flow: `walk` is a common precursor to more intense activity (`jog`) or a return to rest (`stay`). The low counts for transitions involving `stDown` and `stUp` suggest these are brief, specific postural changes (like sitting down or standing up) that occur less frequently within the observed sequence and are less commonly followed by a wide variety of other actions.
The asymmetry in transition counts (e.g., `walk→stay` vs. `stay→walk`) is particularly insightful. It may indicate the context of the observation—for instance, if the subject is more likely to stop (`walk→stay`) after a period of walking than to spontaneously start walking from a standstill (`stay→walk`) within the recorded segments. This could reflect the natural structure of an exercise routine or daily activity log. The data provides a quantitative map of behavioral dynamics, highlighting which state changes are most characteristic of the observed subject or scenario.