## Neural Network Diagram: Audio Event Detection
### Overview
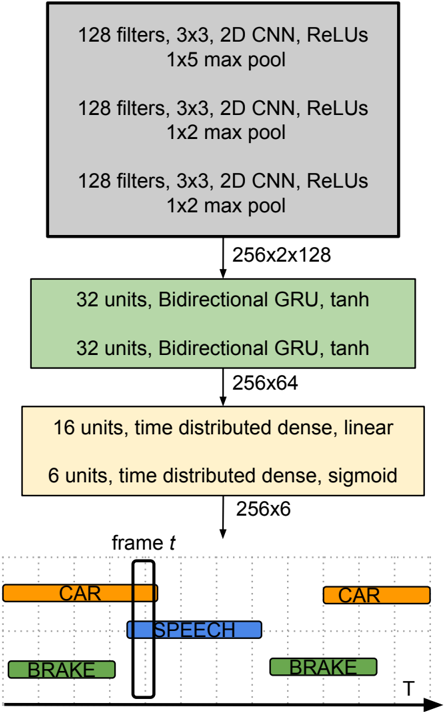
The image is a diagram illustrating a neural network architecture for audio event detection. It shows the flow of data through different layers of the network, starting from convolutional layers, passing through recurrent layers, and ending with time-distributed dense layers. The output is a time-series representation of detected audio events like "Car", "Speech", and "Brake".
### Components/Axes
* **Layers (Top to Bottom):**
* Three gray blocks representing convolutional layers.
* Two green blocks representing bidirectional GRU layers.
* Two yellow blocks representing time-distributed dense layers.
* A time-series representation of detected audio events.
* **Arrows:** Indicate the flow of data from one layer to the next.
* **Time Axis:** The horizontal axis labeled "T" in the bottom section represents time.
* **Frame Indicator:** A vertical line labeled "frame t" indicates a specific time frame.
* **Audio Event Labels:** "CAR", "SPEECH", "BRAKE"
* **Color Coding:**
* Orange: CAR
* Blue: SPEECH
* Green: BRAKE
### Detailed Analysis
**Convolutional Layers (Top):**
* Three identical gray blocks, each representing a set of convolutional layers.
* Each block contains the following information:
* "128 filters, 3x3, 2D CNN, ReLUs"
* The first block has "1x5 max pool"
* The second and third blocks have "1x2 max pool"
* Output dimension from these layers: "256x2x128"
**Recurrent Layers (Middle):**
* Two identical green blocks, each representing a bidirectional GRU layer.
* Each block contains the following information:
* "32 units, Bidirectional GRU, tanh"
* Output dimension from these layers: "256x64"
**Time-Distributed Dense Layers (Bottom-Middle):**
* Two yellow blocks, each representing a time-distributed dense layer.
* The first block contains: "16 units, time distributed dense, linear"
* The second block contains: "6 units, time distributed dense, sigmoid"
* Output dimension from these layers: "256x6"
**Time-Series Representation (Bottom):**
* A grid representing time (T) on the horizontal axis.
* A vertical line labeled "frame t" indicates a specific time frame.
* Three types of audio events are represented as colored horizontal bars:
* Orange bars labeled "CAR" indicate the presence of car sounds. There are two instances of "CAR" events. The first "CAR" event starts at an earlier time and ends around the "frame t" line. The second "CAR" event occurs later in time.
* A blue bar labeled "SPEECH" indicates the presence of speech. The "SPEECH" event is centered around the "frame t" line.
* Green bars labeled "BRAKE" indicate the presence of braking sounds. There are two instances of "BRAKE" events. The first "BRAKE" event occurs at the beginning of the time series, and the second "BRAKE" event occurs towards the end.
### Key Observations
* The network processes audio data through convolutional, recurrent, and dense layers.
* The convolutional layers extract features from the audio input.
* The recurrent layers model the temporal dependencies in the audio signal.
* The time-distributed dense layers predict the presence of different audio events at each time frame.
* The output is a time-series representation of detected audio events.
### Interpretation
The diagram illustrates a neural network designed for audio event detection. The network takes audio input, extracts relevant features using convolutional layers, models the temporal context using recurrent layers, and predicts the presence of specific audio events (like "Car", "Speech", and "Brake") over time. The time-series representation at the bottom shows the network's output, indicating when each event is detected. The "frame t" line represents a specific time frame, and the colored bars indicate the presence of each event at that time. This type of architecture is useful for applications like surveillance, autonomous driving, and audio analysis.