## Multi-Agent Hybrid Pursuit-Evasion Game: State Evolution
### Overview
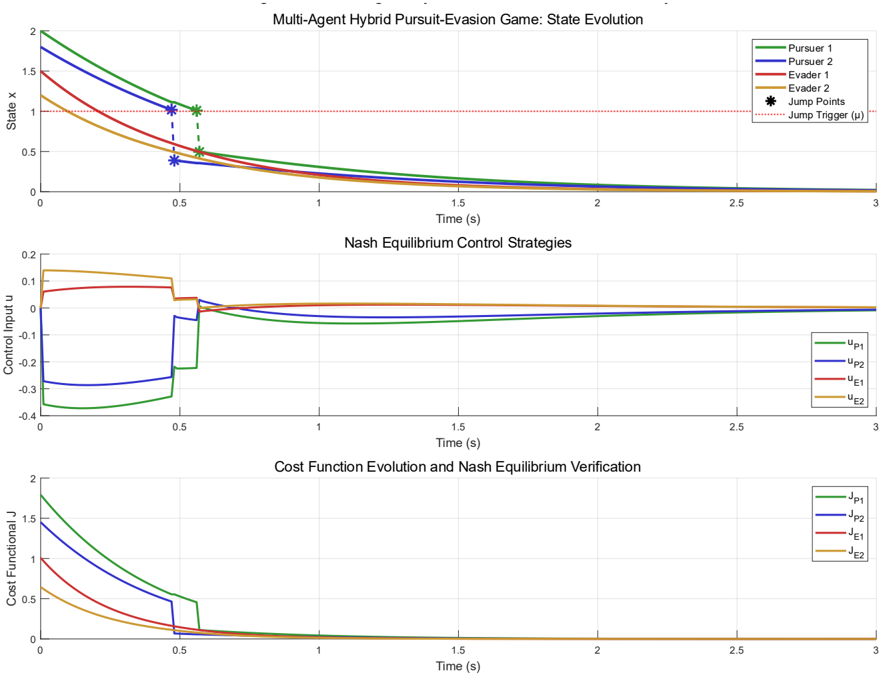
The image presents three line charts illustrating the state evolution, Nash equilibrium control strategies, and cost function evolution in a multi-agent hybrid pursuit-evasion game. The charts share a common x-axis representing time in seconds, ranging from 0 to 3.
### Components/Axes
**Chart 1: Multi-Agent Hybrid Pursuit-Evasion Game: State Evolution**
* **Title:** Multi-Agent Hybrid Pursuit-Evasion Game: State Evolution
* **Y-axis:** State x, ranging from 0 to 2
* **X-axis:** Time (s), ranging from 0 to 3
* **Legend (top-right):**
* Pursuer 1 (Green)
* Pursuer 2 (Blue)
* Evader 1 (Red)
* Evader 2 (Yellow/Orange)
* Jump Points (Black Star)
* Jump Trigger (μ) (Red dotted line)
* **Jump Trigger (μ):** A horizontal dotted red line at approximately y = 1.0
**Chart 2: Nash Equilibrium Control Strategies**
* **Title:** Nash Equilibrium Control Strategies
* **Y-axis:** Control Input u, ranging from -0.4 to 0.2
* **X-axis:** Time (s), ranging from 0 to 3
* **Legend (right):**
* uP1 (Green)
* uP2 (Blue)
* uE1 (Red)
* uE2 (Yellow/Orange)
**Chart 3: Cost Function Evolution and Nash Equilibrium Verification**
* **Title:** Cost Function Evolution and Nash Equilibrium Verification
* **Y-axis:** Cost Functional J, ranging from 0 to 2
* **X-axis:** Time (s), ranging from 0 to 3
* **Legend (right):**
* JP1 (Green)
* JP2 (Blue)
* JE1 (Red)
* JE2 (Yellow/Orange)
### Detailed Analysis
**Chart 1: State Evolution**
* **Pursuer 1 (Green):** Starts at approximately 1.7, decreases rapidly until t=0.5, where it jumps down to approximately 0.5, then decreases more gradually towards 0.
* **Pursuer 2 (Blue):** Starts at approximately 1.5, decreases rapidly until t=0.5, where it jumps down to approximately 0.4, then decreases more gradually towards 0.
* **Evader 1 (Red):** Starts at approximately 1.2, decreases rapidly towards 0.
* **Evader 2 (Yellow/Orange):** Starts at approximately 1.0, decreases rapidly towards 0.
* **Jump Points (Black Stars):** Located at t=0.5 for Pursuer 1 and Pursuer 2.
* **Jump Trigger (μ) (Red dotted line):** Horizontal line at State x = 1.0.
**Chart 2: Nash Equilibrium Control Strategies**
* **uP1 (Green):** Starts at approximately -0.4, jumps up to approximately -0.2 at t=0.5, then gradually increases towards 0.
* **uP2 (Blue):** Starts at approximately -0.3, jumps up to approximately -0.1 at t=0.5, then gradually increases towards 0.
* **uE1 (Red):** Starts at approximately 0.1, decreases slightly, then remains relatively constant near 0.
* **uE2 (Yellow/Orange):** Starts at approximately 0.15, decreases slightly, then remains relatively constant near 0.
**Chart 3: Cost Function Evolution**
* **JP1 (Green):** Starts at approximately 2.0, decreases rapidly until t=0.5, then decreases more gradually towards 0.
* **JP2 (Blue):** Starts at approximately 1.7, decreases rapidly until t=0.5, then decreases more gradually towards 0.
* **JE1 (Red):** Starts at approximately 1.0, decreases rapidly towards 0.
* **JE2 (Yellow/Orange):** Starts at approximately 0.6, decreases rapidly towards 0.
### Key Observations
* The state values of Pursuer 1 and Pursuer 2 experience a discrete jump at t=0.5, indicated by the black star markers.
* The control inputs for the pursuers (uP1 and uP2) also exhibit a jump at t=0.5.
* The cost functions for all agents decrease over time, converging towards 0.
* The jump trigger (μ) at State x = 1.0 seems to be related to the jump points of the pursuers' state values.
### Interpretation
The charts illustrate a pursuit-evasion game where the pursuers and evaders are attempting to optimize their strategies. The state evolution chart shows how the positions of the agents change over time. The jump points in the pursuers' state values likely correspond to a change in strategy or mode of operation, triggered when the state reaches a certain threshold (μ = 1.0). The Nash equilibrium control strategies chart shows the control inputs used by each agent to achieve their objectives. The cost function evolution chart shows how the cost (or loss) associated with each agent's strategy decreases over time, indicating that the agents are converging towards a Nash equilibrium. The sudden changes in the control strategies and state values at t=0.5 suggest a hybrid system with discrete mode switches.