## Multi-Agent Hybrid Pursuit-Evasion Game: State Evolution
### Overview
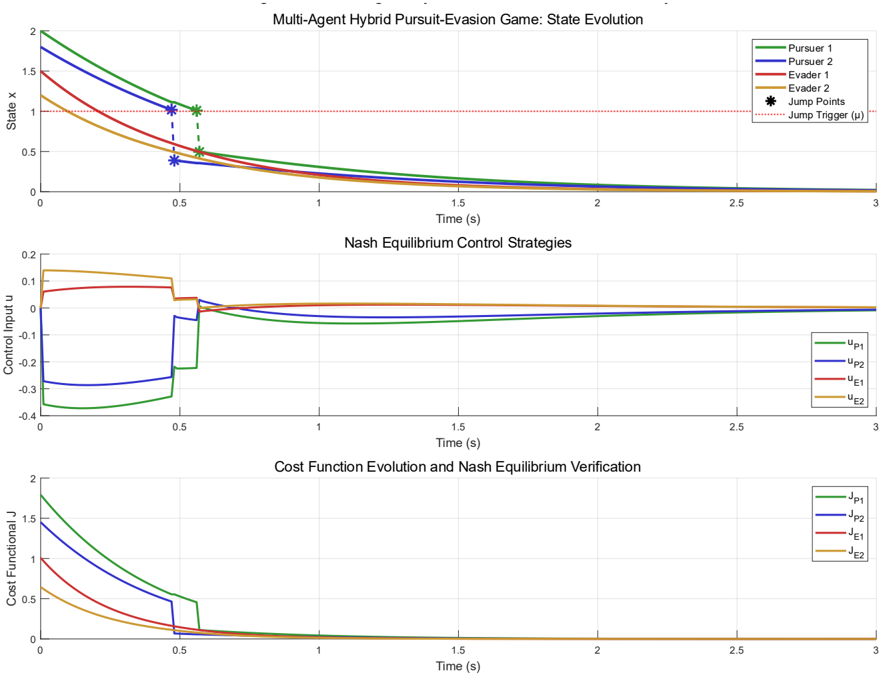
Three interconnected graphs depict the dynamics of a pursuit-evasion game with two pursuers and two evaders. The top chart shows state evolution over time, the middle chart illustrates control strategies, and the bottom chart tracks cost function convergence.
### Components/Axes
1. **Top Chart**:
- **X-axis**: Time (s) from 0 to 3
- **Y-axis**: State x (0 to 2)
- **Legend**:
- Pursuer 1 (green)
- Pursuer 2 (blue)
- Evader 1 (red)
- Evader 2 (orange)
- **Annotations**:
- Jump Points (black stars)
- Jump Trigger (μ=1.0, dashed red line at y=1.0)
2. **Middle Chart**:
- **X-axis**: Time (s) from 0 to 3
- **Y-axis**: Control Input u (-0.4 to 0.2)
- **Legend**:
- u_P1 (green)
- u_P2 (blue)
- u_E1 (red)
- u_E2 (orange)
3. **Bottom Chart**:
- **X-axis**: Time (s) from 0 to 3
- **Y-axis**: Cost Functional J (0 to 2)
- **Legend**:
- J_P1 (green)
- J_P2 (blue)
- J_E1 (red)
- J_E2 (orange)
### Detailed Analysis
**Top Chart**:
- Pursuer 1 (green) starts at state x=2.0, decreases sharply to ~0.5 at 0.5s, then stabilizes near 0.1.
- Pursuer 2 (blue) starts at ~1.5, drops to ~0.4 at 0.5s, then converges to 0.05.
- Evader 1 (red) begins at ~1.5, declines to ~0.3 at 0.5s, then stabilizes near 0.05.
- Evader 2 (orange) starts at ~0.8, drops to ~0.2 at 0.5s, then converges to 0.02.
- Jump Points occur at ~0.5s (state x=1.0) and ~1.0s (state x=0.5), coinciding with the μ=1.0 trigger.
**Middle Chart**:
- Pursuer controls (green/blue) start at -0.3/-0.4, jump to +0.1/+0.05 at 0.5s, then stabilize.
- Evader controls (red/orange) start at +0.1/+0.15, drop to 0 at 0.5s, then remain near 0.
**Bottom Chart**:
- All cost functions (green/blue/red/orange) start near 2.0, drop sharply to ~0.1 by 0.5s, then flatten near 0.01.
- J_P1 (green) and J_P2 (blue) show sharper initial declines than J_E1 (red) and J_E2 (orange).
### Key Observations
1. **State Evolution**: All agents' states converge to near-zero values after 0.5s, with pursuers maintaining higher states than evaders.
2. **Control Strategies**: Pursuers activate positive control inputs at 0.5s (jump points), while evaders deactivate controls entirely.
3. **Cost Function**: All agents achieve Nash equilibrium by 1.0s, with cost functions stabilizing near zero.
### Interpretation
The system demonstrates coordinated agent behavior where pursuers and evaders adjust strategies at μ=1.0 (0.5s mark). The sharp state declines and cost function convergence suggest optimal Nash equilibrium is achieved rapidly. The control input jumps indicate discrete strategy changes triggered by the μ threshold. The bottom chart confirms equilibrium verification through cost function stabilization, with pursuers maintaining slightly higher cost trajectories than evaders, possibly reflecting differing objective weights.