\n
## Diagram: Geometric Solid
### Overview
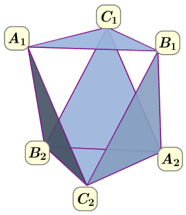
The image depicts a geometric solid, specifically a hexagonal prism with a triangular cross-section removed, resulting in a more complex polyhedron. The diagram is a line drawing with shading to indicate depth and surface visibility. The vertices of the solid are labeled with alphanumeric identifiers.
### Components/Axes
The diagram consists of the following labeled vertices:
* A1
* A2
* B1
* B2
* C1
* C2
There are no explicit axes or scales present in the image. The diagram relies on visual representation of spatial relationships. The lines are colored purple.
### Detailed Analysis or Content Details
The solid appears to be constructed from two hexagonal faces connected by six rectangular faces. However, the top and bottom hexagonal faces are not complete; they have triangular sections removed. The vertices are positioned as follows:
* **A1 and A2** are located at the top and bottom of a vertical edge.
* **B1 and B2** are located at the top and bottom of another vertical edge.
* **C1 and C2** are located at the top and bottom of a third vertical edge.
The edges connecting these vertices form the structure of the polyhedron. The shading indicates that the faces A1B1C1, A2B2C2, and the rectangular faces connecting them are visible. The faces obscured by shading are not directly visible.
### Key Observations
The diagram illustrates a three-dimensional shape with a complex geometry. The labeling of the vertices suggests a systematic naming convention. The removal of triangular sections from the hexagonal faces creates a unique and non-standard polyhedron.
### Interpretation
The diagram likely represents a specific geometric construction or a visualization of a mathematical concept. The labeling of the vertices (A1, A2, B1, B2, C1, C2) suggests that the diagram might be used to illustrate transformations or symmetries of the solid. The shape itself doesn't immediately correspond to a common geometric solid, indicating it may be a custom or derived shape. The diagram is a visual aid for understanding spatial relationships and geometric properties, rather than presenting numerical data. It is a representation of form and structure, not quantity. The diagram is a static representation and does not convey any dynamic information or trends.