## 3D Geometric Diagram: Polyhedron Structure with Labeled Vertices
### Overview
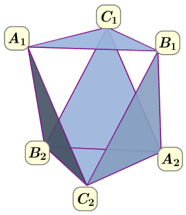
The image depicts a 3D geometric structure resembling a polyhedron with labeled vertices (A₁, A₂, B₁, B₂, C₁, C₂). The diagram uses color-coded regions (light blue, dark blue, purple) to differentiate spatial relationships. The structure includes triangular and quadrilateral faces, with edges connecting the vertices.
### Components/Axes
- **Vertices**:
- **A₁**: Top-left vertex (light blue region).
- **A₂**: Bottom-right vertex (dark blue region).
- **B₁**: Top-right vertex (light blue region).
- **B₂**: Bottom-left vertex (dark blue region).
- **C₁**: Top-center vertex (purple region).
- **C₂**: Bottom-center vertex (purple region).
- **Edges**:
- Connect A₁-B₁, B₁-C₁, C₁-A₁ (top triangular face).
- Connect A₂-B₂, B₂-C₂, C₂-A₂ (bottom triangular face).
- Diagonal edges: A₁-B₂, B₁-C₂, A₂-C₁ (interconnecting regions).
- **Legend**:
- **Light Blue**: Top-left and top-right regions (A₁, B₁).
- **Dark Blue**: Bottom-left and bottom-right regions (A₂, B₂).
- **Purple**: Central regions (C₁, C₂).
- **Spatial Grounding**:
- Legend positioned at the bottom-right corner.
- Vertices labeled with black text on white backgrounds.
### Detailed Analysis
- **Color-Coded Regions**:
- Light blue regions dominate the upper portion (A₁, B₁).
- Dark blue regions occupy the lower portion (A₂, B₂).
- Purple regions (C₁, C₂) act as transitional zones between upper and lower sections.
- **Edge Relationships**:
- Diagonal edges (e.g., A₁-B₂) create intersecting planes, suggesting a non-convex polyhedron.
- Triangular faces (top and bottom) are highlighted with solid lines, while quadrilateral faces use dashed lines.
### Key Observations
1. **Symmetry**: The structure exhibits bilateral symmetry along the vertical axis (C₁-C₂).
2. **Color Coding**: Purple regions (C₁, C₂) serve as bridges between light blue and dark blue zones.
3. **Non-Convexity**: The intersecting diagonal edges imply a concave or complex polyhedral shape.
### Interpretation
This diagram likely represents a geometric model for spatial analysis, such as a Voronoi diagram, Delaunay triangulation, or a 3D mesh for computational geometry. The color coding may indicate zones of influence, material properties, or connectivity constraints. The absence of numerical data suggests the focus is on structural relationships rather than quantitative metrics. The intersecting edges and transitional purple regions highlight potential areas of overlap or interaction between distinct zones.