\n
## Bar Charts: Share of Plastic Waste Management - 2019
### Overview
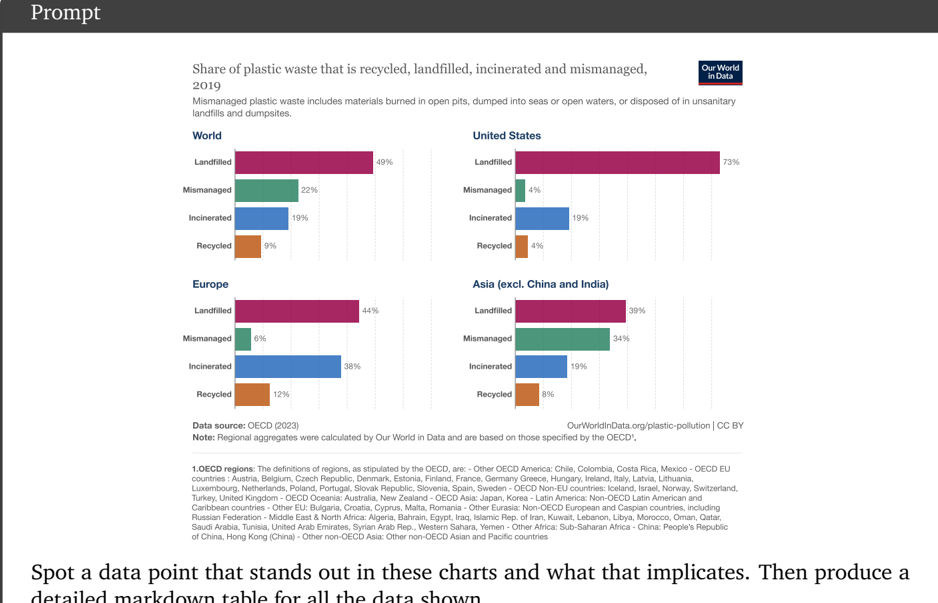
The image presents four horizontal bar charts illustrating the share of plastic waste that is recycled, landfilled, incinerated, and mismanaged in different regions: World, United States, Europe, and Asia (excl. China and India). The data is sourced from the OECD (2023) and visualized by Our World in Data.
### Components/Axes
* **Title:** "Share of plastic waste that is recycled, landfilled, incinerated and mismanaged. 2019"
* **Source:** "Data source: OECD (2023)" and "OurWorldinData.org/plastic-pollution | CC BY"
* **Note:** "Regional aggregates were calculated by Our World in Data and are based on those specified by the OECD."
* **Regions:** World, United States, Europe, Asia (excl. China and India)
* **Categories:** Landfilled, Mismanaged, Incinerated, Recycled
* **Axis:** The Y-axis represents the percentage of plastic waste (0% to 100%). The X-axis represents the categories of waste management.
* **Colors:**
* Landfilled: Light Blue
* Mismanaged: Orange
* Incinerated: Dark Green
* Recycled: Light Green
### Detailed Analysis or Content Details
**1. World:**
* Landfilled: Approximately 49% (visually, the bar extends to just under the 50% mark).
* Mismanaged: Approximately 22% (visually, the bar extends to just over the 20% mark).
* Incinerated: Approximately 19% (visually, the bar extends to just under the 20% mark).
* Recycled: Approximately 9% (visually, the bar extends to just over the 5% mark).
**2. United States:**
* Landfilled: Approximately 73% (visually, the bar extends to just over the 70% mark).
* Mismanaged: Approximately 4% (visually, the bar extends to just over the 0% mark).
* Incinerated: Approximately 19% (visually, the bar extends to just under the 20% mark).
* Recycled: Approximately 4% (visually, the bar extends to just over the 0% mark).
**3. Europe:**
* Landfilled: Approximately 44% (visually, the bar extends to just under the 45% mark).
* Mismanaged: Approximately 6% (visually, the bar extends to just over the 5% mark).
* Incinerated: Approximately 38% (visually, the bar extends to just under the 40% mark).
* Recycled: Approximately 12% (visually, the bar extends to just over the 10% mark).
**4. Asia (excl. China and India):**
* Landfilled: Approximately 39% (visually, the bar extends to just under the 40% mark).
* Mismanaged: Approximately 34% (visually, the bar extends to just over the 30% mark).
* Incinerated: Approximately 19% (visually, the bar extends to just under the 20% mark).
* Recycled: Approximately 8% (visually, the bar extends to just over the 5% mark).
### Key Observations
* The United States has the highest percentage of plastic waste landfilled (73%) and the lowest percentage recycled (4%).
* The World average shows a significant portion of plastic waste is landfilled (49%) and mismanaged (22%).
* Europe has a higher recycling rate (12%) compared to the World, United States, and Asia (excl. China and India).
* Asia (excl. China and India) has a high percentage of mismanaged plastic waste (34%).
### Interpretation
The data highlights significant disparities in plastic waste management practices across different regions. The United States relies heavily on landfilling, indicating a lack of investment in recycling and other waste treatment technologies. The high rate of mismanaged plastic waste in Asia (excl. China and India) suggests inadequate waste collection and disposal infrastructure. Europe demonstrates a more balanced approach, with a relatively higher recycling rate and a lower percentage of mismanaged waste.
The overall trend suggests that a substantial portion of plastic waste globally is either landfilled or mismanaged, posing significant environmental risks. The data underscores the need for improved waste management infrastructure, increased recycling rates, and a reduction in plastic consumption to address the global plastic pollution crisis.
The note regarding the OECD definition of regions is important. The data is based on how the OECD categorizes countries, which may influence the results. The fact that China and India are excluded from the "Asia" category is also noteworthy, as these countries are major contributors to plastic waste generation.
A data point that stands out is the extremely low recycling rate in the United States (4%) compared to the other regions. This implies a systemic issue with recycling infrastructure or participation in the US, and has significant implications for environmental sustainability.